American Airlines 2003 Annual Report Download - page 29
Download and view the complete annual report
Please find page 29 of the 2003 American Airlines annual report below. You can navigate through the pages in the report by either clicking on the pages listed below, or by using the keyword search tool below to find specific information within the annual report.-
 1
1 -
2
-
3
-
4
-
5
-
6
-
7
-
8
-
9
-
10
-
11
-
12
-
13
-
14
-
15
-
16
-
17
-
18
-
 19
19 -
 20
20 -
 21
21 -
 22
22 -
 23
23 -
 24
24 -
 25
25 -
 26
26 -
 27
27 -
 28
28 -
 29
29 -
 30
30 -
 31
31 -
 32
32 -
 33
33 -
 34
34 -
 35
35 -
 36
36 -
 37
37 -
 38
38 -
 39
39 -
40
-
41
-
42
-
43
-
44
-
45
-
46
-
47
-
48
-
49
-
50
-
51
-
52
-
53
-
54
-
55
-
56
-
57
-
58
-
59
-
60
-
61
-
62
-
63
-
64
-
65
-
66
-
67
-
68
-
69
-
70
-
71
-
72
-
73
-
74
-
75
-
76
-
77
-
78
-
79
-
80
-
81
-
82
-
83
-
84
-
85
-
86
-
87
-
88
-
89
-
90
-
91
-
92
-
93
-
94
-
95
-
96
-
97
-
98
-
99
-
100
-
101
-
102
-
103
 |
 |

27
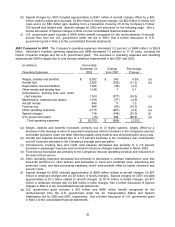
AMR’s net loss in 2003 was $1.2 billion, or $7.76 per share, an improvement of $2.3 billion over AMR’s net loss in
2002 of $3.5 billion, or $22.57 per share. The Company’s 2003 results include several special items which are
discussed in detail in the notes to the consolidated financial statements, including (i) $358 million in security cost
reimbursements received under the Act (see Note 2 to the consolidated financial statements), (ii) $407 million in
special charges (see Note 2 to the consolidated financial statements), (iii) $150 million in gains on the sale of the
Company’s investments in Hotwire and Orbitz (see Note 3 to the consolidated financial statements) and (iv) a $164
million reduction in previously accrued federal income taxes and related interest. In addition, the Company did not
record a tax benefit associated with its 2003 losses. The Company’s 2002 results include a one-time, non-cash
charge to record the cumulative effect of a change in accounting, effective January 1, 2002, of $988 million, or
$6.35 per share, to write-off all of AMR’s goodwill upon the adoption of Statement of Financial Accounting
Standards Board No. 142 “Goodwill and Other Intangible Assets” (see Note 11 to the consolidated financial
statements), and special charges of $718 million (see Note 2 to the consolidated financial statements).
REVENUES
2003 Compared to 2002 The Company’s revenues were relatively flat year-over-year, increasing approximately
$20 million, or 0.1 percent, to $17.4 billion. During the first four months of the year, yields (passenger revenue per
available seat mile) and load factors were down year-over-year, due to the impact of the war in Iraq and SARS. In
the latter part of the year, both yields and load factors improved year-over-year, as the impact of the war in Iraq
and SARS faded, and the U.S. economy began recovering. However, even with the recent improvements, the
Company’s unit revenues and yield are still depressed relative to historical measures.
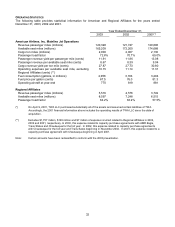
For the full year, American's passenger revenues decreased by 0.7 percent, or $108 million, to $14.3 billion, on a
capacity decrease of 4.1 percent to 165 billion available seat miles (ASMs). American’s passenger load factor
increased 2.1 points to 72.8 percent and passenger revenue yield per passenger mile increased by 0.4 percent, or
0.05 cents, to 11.91 cents, driving American’s passenger revenue per available seat mile (RASM) up by 3.3
percent, or 0.28 cents, to 8.67 cents. In 2003, American derived approximately 70 percent of its passenger
revenues from domestic operations and approximately 30 percent from international operations. Following is
additional information regarding Americans domestic and international RASM and capacity:
Year Ended December 31, 2003
RASM
(cents)
Y-O-Y
Change
ASMs
(billions)
Y-O-Y
Change
Domestic 8.65 4.8% 116 (6.6)%
International 8.72 0.0 49 2.7
Latin America 9.08 (0.1) 24 2.0
Europe 8.53 1.6 21 3.0
Pacific 7.66 (6.8) 4 5.3
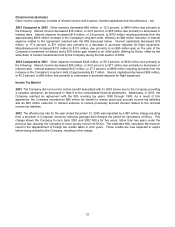
The Company’s Regional Affiliates include two wholly owned subsidiaries, American Eagle Airlines, Inc. and
Executive Airlines, Inc. (collectively, AMR Eagle), and two independent carriers with which American has capacity
purchase agreements, Trans States Airlines, Inc. (Trans States) and Chautauqua Airlines, Inc. (Chautauqua). In
2003, American had capacity purchase agreements with Chautauqua and Trans States for the full year. In 2002,
American had a capacity purchase agreement with Chautauqua for the full year and a capacity purchase
agreement with Trans States beginning in November 2002.
Regional Affiliates’ passenger revenues, which are based on industry standard mileage proration agreements for
flights connecting to American flights, increased $88 million, or 6.1 percent, to $1.5 billion as a result of increased
capacity and load factors. Regional Affiliates’ traffic increased 20.5 percent, or 940 million revenue passenger
miles (RPMs), to 5.5 billion RPMs, while capacity increased 18.6 percent, or 1.3 billion ASMs, to 8.6 billion ASMs.
This is somewhat offset by the elimination, in 2003, of a fee, paid to AMR Eagle by American, for passengers
connecting to American flights.
Cargo revenues remained relatively flat with a decrease of 0.5 percent, or $3 million, to $558 million.