American Airlines 2003 Annual Report Download - page 30
Download and view the complete annual report
Please find page 30 of the 2003 American Airlines annual report below. You can navigate through the pages in the report by either clicking on the pages listed below, or by using the keyword search tool below to find specific information within the annual report.-
 1
1 -
2
-
3
-
4
-
5
-
6
-
7
-
8
-
9
-
10
-
11
-
12
-
13
-
14
-
15
-
16
-
17
-
18
-
19
-
 20
20 -
 21
21 -
 22
22 -
 23
23 -
 24
24 -
 25
25 -
 26
26 -
 27
27 -
 28
28 -
 29
29 -
 30
30 -
 31
31 -
 32
32 -
 33
33 -
 34
34 -
 35
35 -
 36
36 -
 37
37 -
 38
38 -
 39
39 -
 40
40 -
41
-
42
-
43
-
44
-
45
-
46
-
47
-
48
-
49
-
50
-
51
-
52
-
53
-
54
-
55
-
56
-
57
-
58
-
59
-
60
-
61
-
62
-
63
-
64
-
65
-
66
-
67
-
68
-
69
-
70
-
71
-
72
-
73
-
74
-
75
-
76
-
77
-
78
-
79
-
80
-
81
-
82
-
83
-
84
-
85
-
86
-
87
-
88
-
89
-
90
-
91
-
92
-
93
-
94
-
95
-
96
-
97
-
98
-
99
-
100
-
101
-
102
-
103
 |
 |

28
Other revenues increased 4.4 percent, or $43 million, to $1.0 billion due to increases in (i) airfreight service fees
due primarily to fuel surcharges, (ii) AAdvantage program fees, (iii) employee travel service charges, (iv) excess
baggage fees and (v) ticket change fees coupled with changes to the Company’s change fee arrangements with
travel agencies. These increases were offset somewhat by decreases in contract maintenance work that
American performs for other airlines.
2002 Compared to 2001 Although traffic continued to increase on reduced capacity following the events of
September 11, 2001, the Company’s 2002 revenues and yields were down materially year-over-year. In addition
to the residual effects of September 11, the Company’s revenues continued to be negatively impacted by the
economic slowdown, seen largely in business travel declines and changes in business traveler profiles; the
geographic distribution of the Company’s network; and reduced fares due in part to increased competition from
low-cost carriers. TWA LLC purchased substantially all of the assets and assumed certain liabilities of TWA on
April 9, 2001. The results of operations of TWA LLC are included in the Company and American’s results of
operations beginning on that date. The Company’s revenues decreased approximately $1.5 billion, or 8.2 percent,
to $17.4 billion.
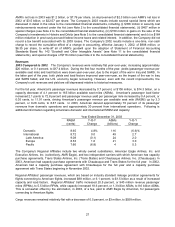
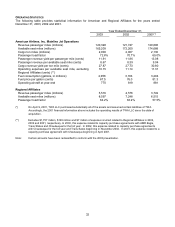
American's passenger revenues decreased by 8.5 percent, or $1.3 billion, to $14.4 billion. American’s passenger
load factor increased by 1.7 points to 70.7 percent while passenger revenue yield per passenger mile decreased
by 9.3 percent, or 1.22 cents, to 11.86 cents, driving American’s RASM down by 7.2 percent, or 0.65 cents, to 8.39
cents. In 2002, American derived approximately 70 percent of its passenger revenues from domestic operations
and approximately 30 percent from international operations. Following is additional information regarding
Americans domestic and international RASM and capacity:
Year Ended December 31, 2002
RASM
(cents)
Y-O-Y
Change
ASMs
(billions)
Y-O-Y
Change
Domestic 8.26 (8.8)% 125 (1.0)%
International 8.72 (2.8) 47 (7.2)
Latin America 9.09 (7.1) 23 (3.3)
Europe 8.40 0.3 20 (7.9)
Pacific 8.22 6.5 4 (22.4)
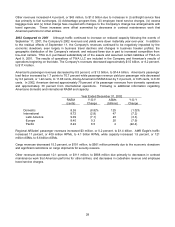
Regional Affiliates’ passenger revenues increased $3 million, or 0.2 percent, to $1.4 billion. AMR Eagle’s traffic
increased 11 percent, or 409 million RPMs, to 4.1 billion RPMs, while capacity increased 1.9 percent, or 121
million ASMs, to 6.6 billion ASMs.
Cargo revenues decreased 15.3 percent, or $101 million, to $561 million primarily due to the economic slowdown
and significant restrictions on cargo shipments for security reasons.
Other revenues decreased 10.1 percent, or $111 million, to $988 million due primarily to decreases in contract
maintenance work that American performs for other airlines, and decreases in codeshare revenue and employee
travel service charges.