American Airlines 2003 Annual Report Download - page 34
Download and view the complete annual report
Please find page 34 of the 2003 American Airlines annual report below. You can navigate through the pages in the report by either clicking on the pages listed below, or by using the keyword search tool below to find specific information within the annual report.-
 1
1 -
2
-
3
-
4
-
5
-
6
-
7
-
8
-
9
-
10
-
11
-
12
-
13
-
14
-
15
-
16
-
17
-
18
-
19
-
20
-
21
-
22
-
23
-
 24
24 -
 25
25 -
 26
26 -
 27
27 -
 28
28 -
 29
29 -
 30
30 -
 31
31 -
 32
32 -
 33
33 -
 34
34 -
 35
35 -
 36
36 -
 37
37 -
 38
38 -
 39
39 -
 40
40 -
 41
41 -
 42
42 -
 43
43 -
 44
44 -
45
-
46
-
47
-
48
-
49
-
50
-
51
-
52
-
53
-
54
-
55
-
56
-
57
-
58
-
59
-
60
-
61
-
62
-
63
-
64
-
65
-
66
-
67
-
68
-
69
-
70
-
71
-
72
-
73
-
74
-
75
-
76
-
77
-
78
-
79
-
80
-
81
-
82
-
83
-
84
-
85
-
86
-
87
-
88
-
89
-
90
-
91
-
92
-
93
-
94
-
95
-
96
-
97
-
98
-
99
-
100
-
101
-
102
-
103
 |
 |

32
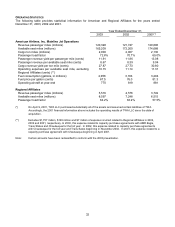
OPERATING STATISTICS
The following table provides statistical information for American and Regional Affiliates for the years ended
December 31, 2003, 2002 and 2001.
Year Ended December 31,
2003 2002 2001(*)
American Airlines, Inc. Mainline Jet Operations
Revenue passenger miles (millions) 120,328 121,747 120,606
Available seat miles (millions) 165,209 172,200 174,688
Cargo ton miles (millions) 2,000 2,007 2,130
Passenger load factor 72.8% 70.7% 69.0%
Passenger revenue yield per passenger mile (cents) 11.91 11.86 13.08
Passenger revenue per available seat mile (cents) 8.67 8.39 9.04
Cargo revenue yield per ton mile (cents) 27.87 27.73 30.80
Operating expenses per available seat mile, excluding
Regional Affiliates (cents) (**)
10.15 11.14 11.31
Fuel consumption (gallons, in millions) 2,956 3,163 3,294
Fuel price per gallon (cents) 87.5 76.0 81.3
Operating aircraft at year-end 770 819 881
Regional Affiliates
Revenue passenger miles (millions) 5,516 4,576 3,749
Available seat miles (millions) 8,597 7,248 6,515
Passenger load factor 64.2% 63.2% 57.5%
(*) On April 9, 2001, TWA LLC purchased substantially all of the assets and assumed certain liabilities of TWA.
Accordingly, the 2001 financial information above includes the operating results of TWA LLC since the date of
acquisition.
(**) Excludes $1,757 million, $129 million and $7 million of expense incurred related to Regional Affiliates in 2003,
2002 and 2001, respectively. In 2003, this expense related to capacity purchase agreements with AMR Eagle,
Trans States and Chautauqua for the full year. In 2002, this expense related to capacity purchase agreements
with Chautauqua for the full year and Trans Sates beginning in November 2002. In 2001, this expense related to a
capacity purchase agreement with Chautauqua beginning in April 2001.
Note: Certain amounts have been reclassified to conform with the 2003 presentation.