American Airlines 2003 Annual Report Download - page 79
Download and view the complete annual report
Please find page 79 of the 2003 American Airlines annual report below. You can navigate through the pages in the report by either clicking on the pages listed below, or by using the keyword search tool below to find specific information within the annual report.-
 1
1 -
2
-
3
-
4
-
5
-
6
-
7
-
8
-
9
-
10
-
11
-
12
-
13
-
14
-
15
-
16
-
17
-
18
-
19
-
20
-
21
-
22
-
23
-
24
-
25
-
26
-
27
-
28
-
29
-
30
-
31
-
32
-
33
-
34
-
35
-
36
-
37
-
38
-
39
-
40
-
41
-
42
-
43
-
44
-
45
-
46
-
47
-
48
-
49
-
50
-
51
-
52
-
53
-
54
-
55
-
56
-
57
-
58
-
59
-
60
-
61
-
62
-
63
-
64
-
65
-
66
-
67
-
68
-
 69
69 -
 70
70 -
 71
71 -
 72
72 -
 73
73 -
 74
74 -
 75
75 -
 76
76 -
 77
77 -
 78
78 -
 79
79 -
 80
80 -
 81
81 -
 82
82 -
 83
83 -
 84
84 -
 85
85 -
 86
86 -
 87
87 -
 88
88 -
 89
89 -
90
-
91
-
92
-
93
-
94
-
95
-
96
-
97
-
98
-
99
-
100
-
101
-
102
-
103
 |
 |

77
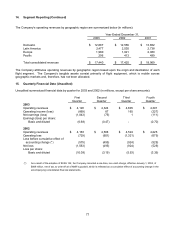
14. Segment Reporting (Continued)
The Company’s operating revenues by geographic region are summarized below (in millions):
Year Ended December 31,
2003 2002 2001
Domestic $ 12,687 $ 12,556 $ 13,652
Latin America 2,477 2,530 2,738
Europe 1,980 1,921 2,080
Pacific 296 413 499
Total consolidated revenues $ 17,440 $ 17,420 $ 18,969
The Company attributes operating revenues by geographic region based upon the origin and destination of each
flight segment. The Company’s tangible assets consist primarily of flight equipment, which is mobile across
geographic markets and, therefore, has not been allocated.
15. Quarterly Financial Data (Unaudited)
Unaudited summarized financial data by quarter for 2003 and 2002 (in millions, except per share amounts):
First
Quarter
Second
Quarter
Third
Quarter
Fourth
Quarter
2003
Operating revenues $ 4,120 $ 4,324 $ 4,605 $ 4,391
Operating income (loss) (869) 87 165 (227)
Net earnings (loss) (1,043) (75) 1 (111)
Earnings (loss) per share:
Basic and diluted (6.68) (0.47) - (0.70)
2002
Operating revenues $ 4,163 $ 4,508 $ 4,524 $ 4,225
Operating loss (729) (601) (1,321) (679)
Loss before cumulative effect of
accounting change (*) (575) (495) (924) (529)
Net loss (1,563) (495) (924) (529)
Loss per share:
Basic and diluted (10.09) (3.19) (5.93) (3.39)
(*) As a result of the adoption of SFAS 142, the Company recorded a one-time, non-cash charge, effective January 1, 2002, of
$988 million, net of tax, to write-off all of AMR’s goodwill, which is reflected as a cumulative effect of accounting change in the
accompanying consolidated financial statements.