American Airlines 2003 Annual Report Download - page 66
Download and view the complete annual report
Please find page 66 of the 2003 American Airlines annual report below. You can navigate through the pages in the report by either clicking on the pages listed below, or by using the keyword search tool below to find specific information within the annual report.-
 1
1 -
2
-
3
-
4
-
5
-
6
-
7
-
8
-
9
-
10
-
11
-
12
-
13
-
14
-
15
-
16
-
17
-
18
-
19
-
20
-
21
-
22
-
23
-
24
-
25
-
26
-
27
-
28
-
29
-
30
-
31
-
32
-
33
-
34
-
35
-
36
-
37
-
38
-
39
-
40
-
41
-
42
-
43
-
44
-
45
-
46
-
47
-
48
-
49
-
50
-
51
-
52
-
53
-
54
-
55
-
 56
56 -
 57
57 -
 58
58 -
 59
59 -
 60
60 -
 61
61 -
 62
62 -
 63
63 -
 64
64 -
 65
65 -
 66
66 -
 67
67 -
 68
68 -
 69
69 -
 70
70 -
 71
71 -
 72
72 -
 73
73 -
 74
74 -
 75
75 -
 76
76 -
77
-
78
-
79
-
80
-
81
-
82
-
83
-
84
-
85
-
86
-
87
-
88
-
89
-
90
-
91
-
92
-
93
-
94
-
95
-
96
-
97
-
98
-
99
-
100
-
101
-
102
-
103
 |
 |

64
7. Financial Instruments and Risk Management (Continued)
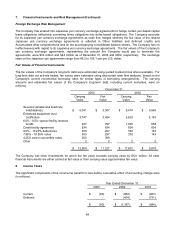
Foreign Exchange Risk Management
The Company has entered into Japanese yen currency exchange agreements to hedge certain yen-based capital
lease obligations (effectively converting these obligations into dollar-based obligations). The Company accounts
for its Japanese yen currency exchange agreements as cash flow hedges whereby the fair value of the related
Japanese yen currency exchange agreements is reflected in Other liabilities and deferred credits and
Accumulated other comprehensive loss on the accompanying consolidated balance sheets. The Company has no
ineffectiveness with regard to its Japanese yen currency exchange agreements. The fair values of the Company’s
yen currency exchange agreements, representing the amount the Company would pay to terminate the
agreements, were $33 million and $44 million as of December 31, 2003 and 2002, respectively. The exchange
rates on the Japanese yen agreements range from 66.5 to 105.1 yen per U.S. dollar.
Fair Values of Financial Instruments
The fair values of the Company's long-term debt were estimated using quoted market prices where available. For
long-term debt not actively traded, fair values were estimated using discounted cash flow analyses, based on the
Company's current incremental borrowing rates for similar types of borrowing arrangements. The carrying
amounts and estimated fair values of the Company's long-term debt, including current maturities, were (in
millions):
December 31,
2003 2002
Carrying
Value
Fair
Value
Carrying
Value
Fair
Value
Secured variable and fixed rate
indebtedness $ 6,041 $ 5,307 $ 5,474 $ 4,569
Enhanced equipment trust
certificates 3,747 3,454 3,623 3,153
6.0% - 8.5% special facility revenue
bonds 947 797 1,035 658
Credit facility agreement 834 834 834 834
9.0% - 10.20% debentures 330 267 330 153
7.88% - 10.55% notes 303 257 303 149
4.25% senior convertible notes 300 309 - -
Other 2222
$ 12,504 $ 11,227 $ 11,601 $ 9,518
The Company has other investments for which the fair value exceeds carrying value by $121 million. All other
financial instruments are either carried at fair value or their carrying value approximates fair value.
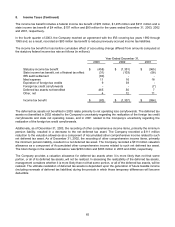
8. Income Taxes
The significant components of the income tax benefit for loss before cumulative effect of accounting change were
(in millions):
Year Ended December 31,
2003 2002 2001
Current $ (80) $ (863) $ (263)
Deferred - (474) (731)
$ (80) $ (1,337) $ (994)