American Airlines 2003 Annual Report Download - page 78
Download and view the complete annual report
Please find page 78 of the 2003 American Airlines annual report below. You can navigate through the pages in the report by either clicking on the pages listed below, or by using the keyword search tool below to find specific information within the annual report.-
 1
1 -
2
-
3
-
4
-
5
-
6
-
7
-
8
-
9
-
10
-
11
-
12
-
13
-
14
-
15
-
16
-
17
-
18
-
19
-
20
-
21
-
22
-
23
-
24
-
25
-
26
-
27
-
28
-
29
-
30
-
31
-
32
-
33
-
34
-
35
-
36
-
37
-
38
-
39
-
40
-
41
-
42
-
43
-
44
-
45
-
46
-
47
-
48
-
49
-
50
-
51
-
52
-
53
-
54
-
55
-
56
-
57
-
58
-
59
-
60
-
61
-
62
-
63
-
64
-
65
-
66
-
67
-
 68
68 -
 69
69 -
 70
70 -
 71
71 -
 72
72 -
 73
73 -
 74
74 -
 75
75 -
 76
76 -
 77
77 -
 78
78 -
 79
79 -
 80
80 -
 81
81 -
 82
82 -
 83
83 -
 84
84 -
 85
85 -
 86
86 -
 87
87 -
 88
88 -
89
-
90
-
91
-
92
-
93
-
94
-
95
-
96
-
97
-
98
-
99
-
100
-
101
-
102
-
103
 |
 |

76
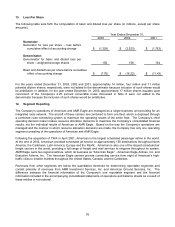
13. Loss Per Share
The following table sets forth the computation of basic and diluted loss per share (in millions, except per share
amounts):
Year Ended December 31,
2003 2002 2001
Numerator:
Numerator for loss per share – loss before
cumulative effect of accounting change $ (1,228) $ (2,523) $ (1,762)
Denominator:
Denominator for basic and diluted loss per
share – weighted-average shares 158 156 154
Basic and diluted loss per share before cumulative
effect of accounting change $ (7.76) $ (16.22) $ (11.43)
For the years ended December 31, 2003, 2002 and 2001, approximately 14 million, four million and 11 million
potential dilutive shares, respectively, were not added to the denominator because inclusion of such shares would
be antidilutive. In addition, for the year ended December 31, 2003, approximately 17 million shares issuable upon
conversion of the Company’s 4.25 percent convertible notes discussed in Note 6 were not added to the
denominator because the inclusion of such shares would be antidilutive.
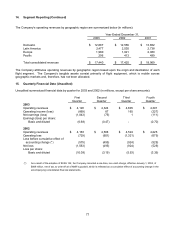
14. Segment Reporting
The Company’s operations of American and AMR Eagle are managed as a single business unit providing for an
integrated route network. The aircraft of these carriers are combined to form one fleet, which is deployed through
a combined route scheduling system to maximize the operating results of the entire fleet. The Company’s chief
operating decision maker makes resource allocation decisions to maximize the Company’s consolidated financial
results, not the individual results of American or AMR Eagle. Based on the way the Company’s operations are
managed and the manner in which resource allocation decisions are made, the Company has only one operating
segment consisting of the operations of American and AMR Eagle.
Following the acquisition of TWA in April 2001, American is the largest scheduled passenger airline in the world.
At the end of 2003, American provided scheduled jet service to approximately 150 destinations throughout North
America, the Caribbean, Latin America, Europe and the Pacific. American is also one of the largest scheduled air
freight carriers in the world, providing a full range of freight and mail services to shippers throughout its system.
AMR Eagle owns two regional airlines, which do business as "American Eagle” - American Eagle Airlines, Inc. and
Executive Airlines, Inc. The American Eagle carriers provide connecting service from eight of American's high-
traffic cities to smaller markets throughout the United States, Canada, and the Caribbean.
Revenues from other segments are below the quantitative threshold for determining reportable segments and
consist primarily of revenues from AMR Investment Services, Inc. and Americas Ground Services, Inc. The
difference between the financial information of the Company’s one reportable segment and the financial
information included in the accompanying consolidated statements of operations and balance sheets as a result of
these entities is not material.