American Airlines 2007 Annual Report Download - page 30
Download and view the complete annual report
Please find page 30 of the 2007 American Airlines annual report below. You can navigate through the pages in the report by either clicking on the pages listed below, or by using the keyword search tool below to find specific information within the annual report.-
 1
1 -
2
-
3
-
4
-
5
-
6
-
7
-
8
-
9
-
10
-
11
-
12
-
13
-
14
-
15
-
16
-
17
-
18
-
19
-
 20
20 -
 21
21 -
 22
22 -
 23
23 -
 24
24 -
 25
25 -
 26
26 -
 27
27 -
 28
28 -
 29
29 -
 30
30 -
 31
31 -
 32
32 -
 33
33 -
 34
34 -
 35
35 -
 36
36 -
 37
37 -
 38
38 -
 39
39 -
 40
40 -
41
-
42
-
43
-
44
-
45
-
46
-
47
-
48
-
49
-
50
-
51
-
52
-
53
-
54
-
55
-
56
-
57
-
58
-
59
-
60
-
61
-
62
-
63
-
64
-
65
-
66
-
67
-
68
-
69
-
70
-
71
-
72
-
73
-
74
-
75
-
76
-
77
-
78
-
79
-
80
-
81
-
82
-
83
-
84
-
85
-
86
-
87
-
88
-
89
-
90
-
91
-
92
-
93
-
94
-
95
-
96
-
97
-
98
-
99
-
100
-
101
-
102
-
103
-
104
-
105
-
106
-
107
 |
 |

27
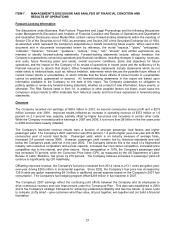
ITEM 7. MANAGEMENT'S DISCUSSION AND ANALYSIS OF FINANCIAL CONDITION AND
RESULTS OF OPERATIONS
Forward-Looking Information
The discussions under Business, Risk Factors, Properties and Legal Proceedings and the following discussions
under Management's Discussion and Analysis of Financial Condition and Results of Operations and Quantitative
and Qualitative Disclosures about Market Risk contain various forward-looking statements within the meaning of
Section 27A of the Securities Act of 1933, as amended, and Section 21E of the Securities Exchange Act of 1934,
as amended, which represent the Company's expectations or beliefs concerning future events. When used in this
document and in documents incorporated herein by reference, the words "expects," "plans," "anticipates,"
“indicates,” “believes,” “forecast,” “guidance,” “outlook,” “may,” “will,” “should,” and similar expressions are
intended to identify forward-looking statements. Forward-looking statements include, without limitation, the
Company’s expectations concerning operations and financial conditions, including changes in capacity, revenues,
and costs, future financing plans and needs, overall economic conditions, plans and objectives for future
operations, and the impact on the Company of its results of operations in recent years and the sufficiency of its
financial resources to absorb that impact. Other forward-looking statements include statements which do not
relate solely to historical facts, such as, without limitation, statements which discuss the possible future effects of
current known trends or uncertainties, or which indicate that the future effects of known trends or uncertainties
cannot be predicted, guaranteed or assured. All forward-looking statements in this report are based upon
information available to the Company on the date of this report. The Company undertakes no obligation to
publicly update or revise any forward-looking statement, whether as a result of new information, future events, or
otherwise. The Risk Factors listed in Item 1A, in addition to other possible factors not listed, could cause the
Company's actual results to differ materially from historical results and from those expressed in forward-looking
statements.
Overview
The Company recorded net earnings of $504 million in 2007, its second consecutive annual profit and a $273
million increase over 2006. Improved results reflected an increase in operating revenue of $372 million or 1.6
percent on 2.3 percent less capacity, partially offset by higher fuel prices and increases in certain other costs.
While the Company recorded positive earnings in 2007 and 2006, it lost more than $8 billion in the five years prior
to 2006 and remains heavily indebted.
The Company’s improved revenue results were a function of stronger passenger load factors and higher
passenger yield. The Company’s 2007 load factor was 80.9 percent, 1.2 points higher year-over-year and its fifth
consecutive year of record load factor. Passenger yield, which is an industry measure of average fares,
increased 2.4 percent versus 2006. However, passenger yield remains low by historical standards and well
below the Company’s peak yield set in the year 2000. The Company believes this is the result of a fragmented
industry with numerous competitors and excess capacity, increased low cost carrier competition, increased price
competition due to the internet, and other factors. Since deregulation in 1978, the Company’s passenger yield
has increased 75 percent, while the Consumer Price Index (CPI), as measured by the US Department of Labor
Bureau of Labor Statistics, has grown by 218 percent. The Company believes increases in passenger yield will
continue to significantly lag CPI indefinitely.
Offsetting improved revenue, the Company’s fuel price increased from 201.4 cents to 213.1 cents per gallon year-
over-year driving $365 million in incremental expense. Since 2002, the Company’s fuel price has increased by
136.9 cents per gallon representing $4.3 billion in additional annual expense based on the Company’s 2007 fuel
consumption. The Company’s fuel hedging program offset $239 million in fuel expense in 2007.
The Company’s 2007 earnings reflect the continuing joint efforts between the Company and its employees to
drive continuous revenue and cost improvement under the Turnaround Plan. This plan was established in 2003
and is the Company’s strategic framework for achieving sustained profitability and has four tenets: (i) lower costs
to compete, (ii) fly smart – give customers what they value, (iii) pull together, win together and (iv) build a financial
foundation.