American Airlines 2007 Annual Report Download - page 77
Download and view the complete annual report
Please find page 77 of the 2007 American Airlines annual report below. You can navigate through the pages in the report by either clicking on the pages listed below, or by using the keyword search tool below to find specific information within the annual report.-
 1
1 -
2
-
3
-
4
-
5
-
6
-
7
-
8
-
9
-
10
-
11
-
12
-
13
-
14
-
15
-
16
-
17
-
18
-
19
-
20
-
21
-
22
-
23
-
24
-
25
-
26
-
27
-
28
-
29
-
30
-
31
-
32
-
33
-
34
-
35
-
36
-
37
-
38
-
39
-
40
-
41
-
42
-
43
-
44
-
45
-
46
-
47
-
48
-
49
-
50
-
51
-
52
-
53
-
54
-
55
-
56
-
57
-
58
-
59
-
60
-
61
-
62
-
63
-
64
-
65
-
66
-
 67
67 -
 68
68 -
 69
69 -
 70
70 -
 71
71 -
 72
72 -
 73
73 -
 74
74 -
 75
75 -
 76
76 -
 77
77 -
 78
78 -
 79
79 -
 80
80 -
 81
81 -
 82
82 -
 83
83 -
 84
84 -
 85
85 -
 86
86 -
 87
87 -
88
-
89
-
90
-
91
-
92
-
93
-
94
-
95
-
96
-
97
-
98
-
99
-
100
-
101
-
102
-
103
-
104
-
105
-
106
-
107
 |
 |

74
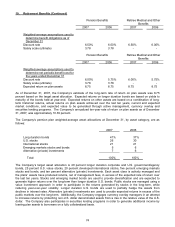
10. Retirement Benefits (Continued)
Pension Benefits Retiree Medical and Other
Benefits
2007 2006 2007 2006
Weighted-average assumptions used to
determine benefit obligations as of
December 31
Discount rate 6.50% 6.00% 6.50% 6.00%
Salary scale (ultimate) 3.78 3.78 - -
Pension Benefits Retiree Medical and Other
Benefits
2007 2006 2007 2006
Weighted-average assumptions used to
determine net periodic benefit cost for
the years ended December 31
Discount rate 6.00% 5.75% 6.00% 5.75%
Salary scale (ultimate) 3.78 3.78 - -
Expected return on plan assets 8.75 8.75 8.75 8.75
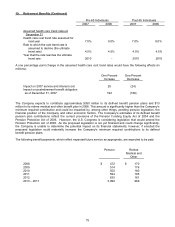
As of December 31, 2007, the Company’s estimate of the long-term rate of return on plan assets was 8.75
percent based on the target asset allocation. Expected returns on longer duration bonds are based on yields to
maturity of the bonds held at year-end. Expected returns on other assets are based on a combination of long-
term historical returns, actual returns on plan assets achieved over the last ten years, current and expected
market conditions, and expected value to be generated through active management, currency overlay and
securities lending programs. The Company’s annualized ten-year rate of return on plan assets as of December
31, 2007, was approximately 10.39 percent.
The Company’s pension plan weighted-average asset allocations at December 31, by asset category, are as
follows:
2007 2006
Long duration bonds 41% 37%
U.S. stocks 26 30
International stocks 21 21
Emerging markets stocks and bonds 5 6
Alternative (private) investments 7 6
Total
100%
100%
The Company’s target asset allocation is 40 percent longer duration corporate and U.S. government/agency
bonds, 25 percent U.S. value stocks, 20 percent developed international stocks, five percent emerging markets
stocks and bonds, and ten percent alternative (private) investments. Each asset class is actively managed and
the plans’ assets have produced returns, net of management fees, in excess of the expected rate of return over
the last ten years. Stocks and emerging market bonds are used to provide diversification and are expected to
generate higher returns over the long-term than longer duration U.S. bonds. Public stocks are managed using a
value investment approach in order to participate in the returns generated by stocks in the long-term, while
reducing year-over-year volatility. Longer duration U.S. bonds are used to partially hedge the assets from
declines in interest rates. Alternative (private) investments are used to provide expected returns in excess of the
public markets over the long-term. Additionally, the Company engages currency overlay managers in an attempt
to increase returns by protecting non-U.S. dollar denominated assets from a rise in the relative value of the U.S.
dollar. The Company also participates in securities lending programs in order to generate additional income by
loaning plan assets to borrowers on a fully collateralized basis.