American Airlines 2007 Annual Report Download - page 42
Download and view the complete annual report
Please find page 42 of the 2007 American Airlines annual report below. You can navigate through the pages in the report by either clicking on the pages listed below, or by using the keyword search tool below to find specific information within the annual report.-
 1
1 -
2
-
3
-
4
-
5
-
6
-
7
-
8
-
9
-
10
-
11
-
12
-
13
-
14
-
15
-
16
-
17
-
18
-
19
-
20
-
21
-
22
-
23
-
24
-
25
-
26
-
27
-
28
-
29
-
30
-
31
-
 32
32 -
 33
33 -
 34
34 -
 35
35 -
 36
36 -
 37
37 -
 38
38 -
 39
39 -
 40
40 -
 41
41 -
 42
42 -
 43
43 -
 44
44 -
 45
45 -
 46
46 -
 47
47 -
 48
48 -
 49
49 -
 50
50 -
 51
51 -
 52
52 -
53
-
54
-
55
-
56
-
57
-
58
-
59
-
60
-
61
-
62
-
63
-
64
-
65
-
66
-
67
-
68
-
69
-
70
-
71
-
72
-
73
-
74
-
75
-
76
-
77
-
78
-
79
-
80
-
81
-
82
-
83
-
84
-
85
-
86
-
87
-
88
-
89
-
90
-
91
-
92
-
93
-
94
-
95
-
96
-
97
-
98
-
99
-
100
-
101
-
102
-
103
-
104
-
105
-
106
-
107
 |
 |

39
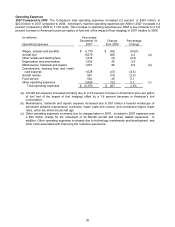
Operating Statistics
The following table provides statistical information for American and Regional Affiliates for the years ended
December 31, 2007, 2006 and 2005.
Year Ended December 31,
2007 2006 2005
American Airlines, Inc. Mainline Jet Operations
Revenue passenger miles (millions) 138,453 139,454 138,374
Available seat miles (millions) 169,906 174,021 176,112
Cargo ton miles (millions) 2,122 2,224 2,209
Passenger load factor 81.5% 80.1% 78.6%
Passenger revenue yield per passenger mile (cents) 13.17 12.81 12.01
Passenger revenue per available seat mile (cents) 10.73 10.26 9.43
Cargo revenue yield per ton mile (cents) 38.86 37.18 35.49
Operating expenses per available seat mile, excluding
Regional Affiliates (cents) (*)
11.38
10.90
10.50
Fuel consumption (gallons, in millions) 2,834 2,881
2,948
Fuel price per gallon (cents) 212.1 200.8
172.3
Operating aircraft at year-end 655 697 699
Regional Affiliates
Revenue passenger miles (millions) 9,848 9,972 8,946
Available seat miles (millions) 13,414 13,554 12,714
Passenger load factor 73.4% 73.6% 70.4%
(*) Excludes $2.8 billion, $2.7 billion and $2.5 billion of expense incurred related to Regional Affiliates in 2007, 2006
and 2005, respectively.
Outlook
Capacity for American’s mainline jet operations is expected to decrease by 0.6 percent in the first quarter of 2008
versus first quarter 2007. American’s mainline capacity for the full year 2008 is expected to increase
approximately 0.2 percent from 2007 with a 1.1 percent reduction in domestic capacity and a 2.5 percent increase
in international capacity. On a consolidated basis capacity is expected to be flat compared to 2007. This capacity
forecast differs from that provided on January 16, 2008, when the Company announced its fourth quarter 2007
results. The Company is analyzing the impact of this planned capacity reduction on the unit cost forecast
provided on January 16. The Company expects to provide revised unit cost guidance in March 2008 in its first
quarter 2008 Eagle Eye investor update.
Other Information
Critical Accounting Policies and Estimates The preparation of the Company’s financial statements in
conformity with generally accepted accounting principles requires management to make estimates and
assumptions that affect the amounts reported in the consolidated financial statements and accompanying notes.
The Company believes its estimates and assumptions are reasonable; however, actual results and the timing of
the recognition of such amounts could differ from those estimates. The Company has identified the following
critical accounting policies and estimates used by management in the preparation of the Company’s financial
statements: accounting for long-lived assets, routes, passenger revenue, frequent flyer program, stock
compensation, pensions and other postretirement benefits, income taxes and derivatives accounting.