American Airlines 2007 Annual Report Download - page 38
Download and view the complete annual report
Please find page 38 of the 2007 American Airlines annual report below. You can navigate through the pages in the report by either clicking on the pages listed below, or by using the keyword search tool below to find specific information within the annual report.-
 1
1 -
2
-
3
-
4
-
5
-
6
-
7
-
8
-
9
-
10
-
11
-
12
-
13
-
14
-
15
-
16
-
17
-
18
-
19
-
20
-
21
-
22
-
23
-
24
-
25
-
26
-
27
-
 28
28 -
 29
29 -
 30
30 -
 31
31 -
 32
32 -
 33
33 -
 34
34 -
 35
35 -
 36
36 -
 37
37 -
 38
38 -
 39
39 -
 40
40 -
 41
41 -
 42
42 -
 43
43 -
 44
44 -
 45
45 -
 46
46 -
 47
47 -
 48
48 -
49
-
50
-
51
-
52
-
53
-
54
-
55
-
56
-
57
-
58
-
59
-
60
-
61
-
62
-
63
-
64
-
65
-
66
-
67
-
68
-
69
-
70
-
71
-
72
-
73
-
74
-
75
-
76
-
77
-
78
-
79
-
80
-
81
-
82
-
83
-
84
-
85
-
86
-
87
-
88
-
89
-
90
-
91
-
92
-
93
-
94
-
95
-
96
-
97
-
98
-
99
-
100
-
101
-
102
-
103
-
104
-
105
-
106
-
107
 |
 |

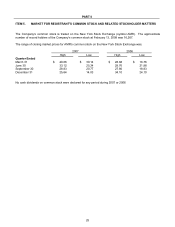
35
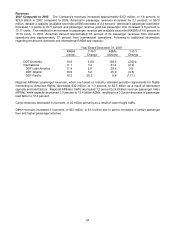
2006 Compared to 2005 The Company’s revenues increased approximately $1.9 billion, or 8.9 percent, to
$22.6 billion in 2006 compared to 2005. American’s passenger revenues increased by 7.5 percent, or $1.2 billion,
despite a capacity (available seat mile) (ASM) decrease of 1.2 percent. American’s passenger load factor
increased 1.5 points to 80.1 percent and passenger revenue yield per passenger mile increased 6.7 percent to
12.81 cents. This resulted in an increase in passenger revenue per available seat mile (RASM) of 8.8 percent to
10.26 cents. In 2006, American derived approximately 64 percent of its passenger revenues from domestic
operations and approximately 36 percent from international operations. Following is additional information
regarding American’s domestic and international RASM and capacity:
Year Ended December 31, 2006
RASM
(cents)
Y-O-Y
Change
ASMs
(billions)
Y-O-Y
Change
DOT Domestic 10.24 9.3% 111 (3.2)%
International 10.30 7.8 63 2.7
DOT Latin America 10.78 13.7 30 (2.1)
DOT Atlantic 10.34 2.6 25 4.6
DOT Pacific 8.49 4.6 8 16.7
Regional Affiliates’ passenger revenues, which are based on industry standard proration agreements for flights
connecting to American flights, increased $354 million, or 16.5 percent, to $2.5 billion as a result of increased
capacity and load factors. Regional Affiliates’ traffic increased 11.5 percent to 10.0 billion revenue passenger
miles (RPMs), while capacity increased 6.6 percent to 13.6 billion ASMs, resulting in a 3.2 point increase in
passenger load factor to 73.6 percent.
Cargo revenues increased 5.5 percent, or $43 million as a result of a $31 million increase in mail revenue and a
$26 million increase in freight fuel surcharges.
Other revenues increased 17.7 percent, or $206 million, to $1.4 billion due in part to increased third-party
maintenance contracts obtained by the Company’s maintenance and engineering group and increases in certain
passenger fees.