American Airlines 2007 Annual Report Download - page 81
Download and view the complete annual report
Please find page 81 of the 2007 American Airlines annual report below. You can navigate through the pages in the report by either clicking on the pages listed below, or by using the keyword search tool below to find specific information within the annual report.-
 1
1 -
2
-
3
-
4
-
5
-
6
-
7
-
8
-
9
-
10
-
11
-
12
-
13
-
14
-
15
-
16
-
17
-
18
-
19
-
20
-
21
-
22
-
23
-
24
-
25
-
26
-
27
-
28
-
29
-
30
-
31
-
32
-
33
-
34
-
35
-
36
-
37
-
38
-
39
-
40
-
41
-
42
-
43
-
44
-
45
-
46
-
47
-
48
-
49
-
50
-
51
-
52
-
53
-
54
-
55
-
56
-
57
-
58
-
59
-
60
-
61
-
62
-
63
-
64
-
65
-
66
-
67
-
68
-
69
-
70
-
 71
71 -
 72
72 -
 73
73 -
 74
74 -
 75
75 -
 76
76 -
 77
77 -
 78
78 -
 79
79 -
 80
80 -
 81
81 -
 82
82 -
 83
83 -
 84
84 -
 85
85 -
 86
86 -
 87
87 -
 88
88 -
 89
89 -
 90
90 -
 91
91 -
92
-
93
-
94
-
95
-
96
-
97
-
98
-
99
-
100
-
101
-
102
-
103
-
104
-
105
-
106
-
107
 |
 |

78
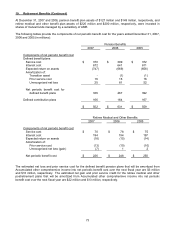
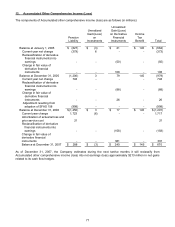
13. Earnings (Loss) Per Share
The following table sets forth the computation of basic and diluted earnings (loss) per share (in millions, except
per share amounts):
Year Ended December 31,
2007 2006 2005
Numerator:
Net earnings (loss) – numerator for basic
earnings (loss) per share
$ 504
$ 231
$ (857)
Interest on senior convertible notes 27 27 -
Net earnings (loss) adjusted for interest on
senior convertible notes – numerator for
diluted earnings per share
$ 531
$ 258
$ (857)
Denominator:
Denominator for basic earnings (loss) per
share – weighted average shares
245
205
165
Effect of dilutive securities:
Senior convertible notes 32 32 -
Employee options and shares 34 44 -
Assumed treasury shares purchased (12) (17) -
Diluted potential common shares
Denominator for diluted earnings loss per
share – weighted-average shares
299
264
165
Basic earnings (loss) per share $ 2.06 $ 1.13 $ (5.18)
Diluted earnings (loss) per share $ 1.78 $ 0.98 $ (5.18)
For the year ended December 31, 2007 and 2006, approximately 7 million and 10 million shares related to
employee stock options were not added to the denominator because the options’ exercise prices were greater
than the average market price of the common shares. Approximately 78 million shares issuable upon conversion
of the Company’s convertible notes, employee stock options and deferred stock were not added to the
denominator for the year ended December 31, 2005 because inclusion of such shares would be antidilutive.
14. Segment Reporting
The Company's operations of American and AMR Eagle are treated as an integrated route network and the route
scheduling system maximizes the operating results of the Company. The Company's chief operating decision
maker makes resource allocation decisions to maximize the Company's consolidated financial results. Based on
the way the Company treats the network and the manner in which resource allocation decisions are made, the
Company has only one operating segment for financial reporting purposes consisting of the operations of
American and AMR Eagle.
American is largest scheduled passenger airline in the world in terms of available seat miles and revenue
passenger miles. At the end of 2007, American provided scheduled jet service to approximately 170 destinations
throughout North America, the Caribbean, Latin America, Europe and Asia. American is also one of the largest
scheduled air freight carriers in the world, providing a full range of freight and mail services to shippers throughout
its system onboard American’s passenger fleet. AMR Eagle owns two regional airlines, which do business as
"American Eagle” - American Eagle Airlines, Inc. and Executive Airlines, Inc. The American Eagle® carriers
provide connecting service from eight of American's high-traffic cities to smaller markets throughout the United
States, Canada, Mexico and the Caribbean.