American Airlines 2007 Annual Report Download - page 68
Download and view the complete annual report
Please find page 68 of the 2007 American Airlines annual report below. You can navigate through the pages in the report by either clicking on the pages listed below, or by using the keyword search tool below to find specific information within the annual report.-
 1
1 -
2
-
3
-
4
-
5
-
6
-
7
-
8
-
9
-
10
-
11
-
12
-
13
-
14
-
15
-
16
-
17
-
18
-
19
-
20
-
21
-
22
-
23
-
24
-
25
-
26
-
27
-
28
-
29
-
30
-
31
-
32
-
33
-
34
-
35
-
36
-
37
-
38
-
39
-
40
-
41
-
42
-
43
-
44
-
45
-
46
-
47
-
48
-
49
-
50
-
51
-
52
-
53
-
54
-
55
-
56
-
57
-
 58
58 -
 59
59 -
 60
60 -
 61
61 -
 62
62 -
 63
63 -
 64
64 -
 65
65 -
 66
66 -
 67
67 -
 68
68 -
 69
69 -
 70
70 -
 71
71 -
 72
72 -
 73
73 -
 74
74 -
 75
75 -
 76
76 -
 77
77 -
 78
78 -
79
-
80
-
81
-
82
-
83
-
84
-
85
-
86
-
87
-
88
-
89
-
90
-
91
-
92
-
93
-
94
-
95
-
96
-
97
-
98
-
99
-
100
-
101
-
102
-
103
-
104
-
105
-
106
-
107
 |
 |

65
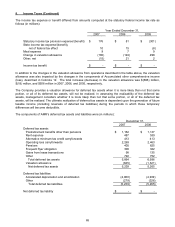
8. Income Taxes (Continued)
The income tax expense or benefit differed from amounts computed at the statutory federal income tax rate as
follows (in millions):
Year Ended December 31,
2007 2006 2005
Statutory income tax provision expense/(benefit) $ 176 $ 81 $ (301)
State income tax expense/(benefit),
net of federal tax effect
10
15
(8)
Meal expense 9 7 9
Change in valuation allowance (180) (124) 298
Other, net (15) 21 2
Income tax benefit $ - $ - $ -
In addition to the changes in the valuation allowance from operations described in the table above, the valuation
allowance was also impacted by the changes in the components of Accumulated other comprehensive income
(loss), described in footnote 12. The total increase (decrease) in the valuation allowance was $(696) million,
$(18) million, and $506 million in 2007, 2006, and 2005, respectively.
The Company provides a valuation allowance for deferred tax assets when it is more likely than not that some
portion, or all of its deferred tax assets, will not be realized. In assessing the realizability of the deferred tax
assets, management considers whether it is more likely than not that some portion, or all of the deferred tax
assets, will be realized. The ultimate realization of deferred tax assets is dependent upon the generation of future
taxable income (including reversals of deferred tax liabilities) during the periods in which those temporary
differences will become deductible.
The components of AMR's deferred tax assets and liabilities were (in millions):
December 31,
2007 2006
Deferred tax assets:
Postretirement benefits other than pensions $ 1,162 $ 1,137
Rent expense 487 539
Alternative minimum tax credit carryforwards 413 413
Operating loss carryforwards 2,269 2,463
Pensions 405 825
Frequent flyer obligation 308 322
Gains from lease transactions 98 135
Other 722 752
Total deferred tax assets 5,864 6,586
Valuation allowance (625) (1,321)
Net deferred tax assets 5,239 5,265
Deferred tax liabilities:
Accelerated depreciation and amortization (4,960) (4,939)
Other (279) (326)
Total deferred tax liabilities (5,239) (5,265)
Net deferred tax liability $ - $ -