Apple 2002 Annual Report Download - page 16
Download and view the complete annual report
Please find page 16 of the 2002 Apple annual report below. You can navigate through the pages in the report by either clicking on the pages listed below, or by using the keyword search tool below to find specific information within the annual report.-
 1
1 -
2
-
3
-
4
-
5
-
 6
6 -
 7
7 -
 8
8 -
 9
9 -
 10
10 -
 11
11 -
 12
12 -
 13
13 -
 14
14 -
 15
15 -
 16
16 -
 17
17 -
 18
18 -
 19
19 -
 20
20 -
 21
21 -
 22
22 -
 23
23 -
 24
24 -
 25
25 -
 26
26 -
27
-
28
-
29
-
30
-
31
-
32
-
33
-
34
-
35
-
36
-
37
-
38
-
39
-
40
-
41
-
42
-
43
-
44
-
45
-
46
-
47
-
48
-
49
-
50
-
51
-
52
-
53
-
54
-
55
-
56
-
57
-
58
-
59
-
60
-
61
-
62
-
63
-
64
-
65
-
66
-
67
-
68
-
69
-
70
-
71
-
72
-
73
-
74
-
75
-
76
-
77
-
78
-
79
-
80
-
81
-
82
-
83
-
84
-
85
-
86
-
87
-
88
-
89
-
90
 |
 |

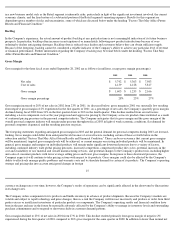
The Company's common stock is traded on the over-the-
counter market and is quoted on the Nasdaq National Market under the symbol AAPL,
on the Tokyo Stock Exchange under the symbol APPLE, and on the Frankfurt Stock Exchange under the symbol APCD. As of December 6,
2002, there were 28,310 shareholders of record.
On June 21, 2000, the Company effected a two-for-one stock split in the form of a Common Stock dividend to shareholders of record as of
May 19, 2000. All share price and per share data and numbers of Common shares have been retroactively adjusted to reflect the stock split. The
Company did not pay cash dividends in either fiscal 2002 or 2001. The Company anticipates that, for the foreseeable future, it will retain any
earnings for use in the operation of its business. The price range per share of common stock presented below represents the highest and lowest
closing prices for the Company's common stock on the Nasdaq National Market during each quarter.
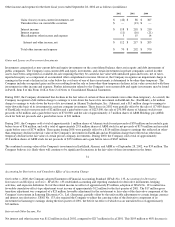
Item 6. Selected Financial Data
The following selected financial information has been derived from the audited consolidated financial statements. The information set forth
below is not necessarily indicative of results of future operations, and should be read in conjunction with Item 7, "Management's Discussion
and Analysis of Financial Condition and Results of Operations" and the consolidated financial statements and related notes thereto included in
Item 8 of this Form 10-K in order to fully understand factors that may affect the comparability of the information presented below.
A net loss before taxes related to the Company's non-current debt and equity investments of $42 million was recognized in 2002. Net gains
before taxes related to the Company's non-current debt and equity investments of $75 million, $367 million, $230 million, and $40 million
were recognized in 2001, 2000, 1999, and 1998, respectively. In 2002, the Company acquired Emagic resulting in a charge of approximately
18
$1 million for acquired in-process technologies with no alternative future use. The Company recognized a similar charge of $11 million in
2001 related to its acquisition of PowerSchool. Net charges related to Company restructuring actions of $30 million, $8 million, and
$27 million were recognized in 2002, 2000, and 1999, respectively. During 2000, the Company recognized the cost of a special executive
bonus for the Company's Chief Executive Officer for past services in the form of an aircraft with a total cost to the Company of approximately
$90 million. In 2002, of the original $90 million accrual, $2 million remained unspent and was reversed.
Item 7. Management's Discussion and Analysis of Financial Condition and Results of Operations
This section and other parts of this Form 10-K contain forward-looking statements that involve risks and uncertainties. The Company's actual
results may differ significantly from the results discussed in the forward-looking statements. Factors that might cause such differences include,
but are not limited to, those discussed in the subsection entitled "Factors That May Affect Future Results and Financial Condition" below. The
following discussion should be read in conjunction with the consolidated financial statements and notes thereto included in Item 8 of this
Fourth Quarter
Third Quarter
Second Quarter
First Quarter
Fiscal 2002 price range per common share
$
18.74
-
$13.99
$
26.11
-
$16.55
$
25.45
-
$20.78
$
23.76
-
$14.98
Fiscal 2001 price range per common share
$
25.22
-
$14.68
$
27.12
-
$18.75
$
23.75
-
$14.44
$
26.75
-
$13.63
Five fiscal years ended September 28, 2002
(In millions, except share and per share amounts)
2002
2001
2000
1999
1998
Net sales
$
5,742
$
5,363
$
7,983
$
6,134
$
5,941
Net income (loss)
$
65
$
(25
)
$
786
$
601
$
309
Earnings (loss) per common share:
Basic
$
0.18
$
(0.07
)
$
2.42
$
2.10
$
1.17
Diluted
$
0.18
$
(0.07
)
$
2.18
$
1.81
$
1.05
Cash dividends declared per common share
$
—
$
—
$
—
$
—
$
—
Shares used in computing earnings (loss) per share (in
thousands):
Basic
355,022
345,613
324,568
286,314
263,948
Diluted
361,785
345,613
360,324
348,328
335,834
Cash, cash equivalents, and short
-
term investments
$
4,337
$
4,336
$
4,027
$
3,226
$
2,300
Total assets
$
6,298
$
6,021
$
6,803
$
5,161
$
4,289
Long
-
term debt
$
316
$
317
$
300
$
300
$
954
Total liabilities
$
2,203
$
2,101
$
2,696
$
2,057
$
2,647
Shareholders' equity
$
4,095
$
3,920
$
4,107
$
3,104
$
1,642