Apple 2002 Annual Report Download - page 65
Download and view the complete annual report
Please find page 65 of the 2002 Apple annual report below. You can navigate through the pages in the report by either clicking on the pages listed below, or by using the keyword search tool below to find specific information within the annual report.-
 1
1 -
2
-
3
-
4
-
5
-
6
-
7
-
8
-
9
-
10
-
11
-
12
-
13
-
14
-
15
-
16
-
17
-
18
-
19
-
20
-
21
-
22
-
23
-
24
-
25
-
26
-
27
-
28
-
29
-
30
-
31
-
32
-
33
-
34
-
35
-
36
-
37
-
38
-
39
-
40
-
41
-
42
-
43
-
44
-
45
-
46
-
47
-
48
-
49
-
50
-
51
-
52
-
53
-
54
-
 55
55 -
 56
56 -
 57
57 -
 58
58 -
 59
59 -
 60
60 -
 61
61 -
 62
62 -
 63
63 -
 64
64 -
 65
65 -
 66
66 -
 67
67 -
 68
68 -
 69
69 -
 70
70 -
 71
71 -
 72
72 -
 73
73 -
 74
74 -
 75
75 -
76
-
77
-
78
-
79
-
80
-
81
-
82
-
83
-
84
-
85
-
86
-
87
-
88
-
89
-
90
 |
 |

(a)
Operating income $
122
$
68
$
243
Depreciation and amortization $
4
$
6
$
4
Segment assets $
165
$
137
$
248
Japan:
Net sales
$
710
$
713
$
1,345
Operating income $
140
$
98
$
352
Depreciation and amortization $
2
$
2
$
2
Segment assets $
50
$
44
$
137
Retail:
Net sales
$
283
$
19
—
Operating income $
(22
) $
(21
)
—
Depreciation and amortization(b) $
16
$
2
—
Segment assets(b) $
141
$
46
—
Other Segment:
Net sales
$
410
$
386
$
523
Operating income $
88
$
63
$
137
Depreciation and amortization $
2
$
2
$
3
Segment assets $
67
$
70
$
95
The Americas asset figures do not include fixed assets held in the United States. Such fixed assets are not allocated specifically
to the Americas segment and are included in the corporate assets figures below.
(b) Retail segment depreciation and asset figures reflect the cost and related depreciation of its retail stores and related
infrastructure. Retail store construction-in-progress, which is not subject to depreciation, is reflected in corporate assets.
83
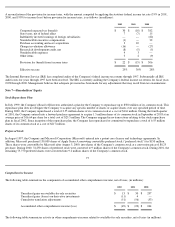
A reconciliation of the Company's segment operating income, and assets to the consolidated financial statements follows (in millions):
A large portion of the Company's net sales is derived from its international operations. Also, a majority of the raw materials used in the
Company's products is obtained from sources outside of the United States, and a majority of the products sold by the Company is assembled
internationally in the Company's facilities in Cork, Ireland and Singapore or by third-party vendors in Taiwan, Korea, Mexico, the People's
Republic of China, and the Czech Republic. As a result, the Company is subject to risks associated with foreign operations, such as obtaining
2002
2001
2000
Segment operating income
$
608
$
341
$
1,346
Corporate expenses, net
(562
)
(674
)
(726
)
Purchased in
-
process research and development
(1
)
(11
)
—
Restructuring costs
(30
)
—
(
8
)
Executive bonus
2
—
(
90
)
Consolidated operating income $
17
$
(344
) $
522
Segment assets
$
818
$
630
$
1,098
Corporate assets
$
5,480
$
5,391
$
5,705
Consolidated assets $
6,298
$
6,021
$
6,803
Segment depreciation and amortization
$
28
$
16
$
14
Corporate depreciation and amortization
90
86
70
Consolidated depreciation and amortization $
118
$
102
$
84