Apple 2002 Annual Report Download - page 66
Download and view the complete annual report
Please find page 66 of the 2002 Apple annual report below. You can navigate through the pages in the report by either clicking on the pages listed below, or by using the keyword search tool below to find specific information within the annual report.-
 1
1 -
2
-
3
-
4
-
5
-
6
-
7
-
8
-
9
-
10
-
11
-
12
-
13
-
14
-
15
-
16
-
17
-
18
-
19
-
20
-
21
-
22
-
23
-
24
-
25
-
26
-
27
-
28
-
29
-
30
-
31
-
32
-
33
-
34
-
35
-
36
-
37
-
38
-
39
-
40
-
41
-
42
-
43
-
44
-
45
-
46
-
47
-
48
-
49
-
50
-
51
-
52
-
53
-
54
-
55
-
 56
56 -
 57
57 -
 58
58 -
 59
59 -
 60
60 -
 61
61 -
 62
62 -
 63
63 -
 64
64 -
 65
65 -
 66
66 -
 67
67 -
 68
68 -
 69
69 -
 70
70 -
 71
71 -
 72
72 -
 73
73 -
 74
74 -
 75
75 -
 76
76 -
77
-
78
-
79
-
80
-
81
-
82
-
83
-
84
-
85
-
86
-
87
-
88
-
89
-
90
 |
 |

governmental permits and approvals, currency exchange fluctuations, currency restrictions, political instability, labor problems, trade
restrictions, and changes in tariff and freight charges. During 2000, a single distributor, Ingram Micro Inc. accounted for approximately 11.5%
of the Company's net sales. Net sales during 2000 to Ingram Micro Inc. in the Americas and Europe segments were $651 million and
$255 million, respectively. Net sales to Ingram Micro Inc. in all other segments were $14 million. No other single customer accounted for more
than 10% of net sales in 2000. No single customer accounted for more than 10% of net sales in 2002 or 2001.
84
Net sales and long
-lived assets related to operations in the United States, Japan, and other foreign countries are as follows (in millions):
Information regarding net sales by product is as follows (in millions):
(a)
2002
2001
2000
Net Sales:
United States
$
3,272
$
2,936
$
4,145
Japan
710
713
1,345
Other Foreign Countries
1,760
1,714
2,493
Total Net Sales $
5,742
$
5,363
$
7,983
Long
-
Lived Assets:
United States
$
561
$
498
$
387
Japan
2
3
5
Other Foreign Countries
69
77
52
Total Long-Lived Assets $
632
$
578
$
444
2002
2001
2000
Net Sales:
Power Macintosh(a)
$
1,380
$
1,664
$
2,747
PowerBook
831
813
948
iMac
1,448
1,117
2,381
iBook
875
809
809
Software, Service, and Other Net Sales
1,208
960
1,098
Total Net Sales $
5,742
$
5,363
$
7,983
Includes server sales and amounts previously reported as G4 Cube.
85
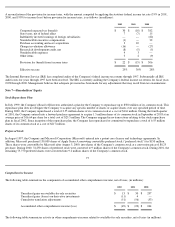
Note 12—Earnings Per Common Share
The following table sets forth the computation of basic and diluted earnings per share (in thousands, except net income (loss) and per
share amounts):
For the Years Ended
September 28,
2002
September 29,
2001
September 30,
2000
Numerator (in millions):
Income (loss) before accounting change
$
65
$
(37
)
$
786
Denominator: