Apple 2002 Annual Report Download - page 24
Download and view the complete annual report
Please find page 24 of the 2002 Apple annual report below. You can navigate through the pages in the report by either clicking on the pages listed below, or by using the keyword search tool below to find specific information within the annual report.-
 1
1 -
2
-
3
-
4
-
5
-
6
-
7
-
8
-
9
-
10
-
11
-
12
-
13
-
 14
14 -
 15
15 -
 16
16 -
 17
17 -
 18
18 -
 19
19 -
 20
20 -
 21
21 -
 22
22 -
 23
23 -
 24
24 -
 25
25 -
 26
26 -
 27
27 -
 28
28 -
 29
29 -
 30
30 -
 31
31 -
 32
32 -
 33
33 -
 34
34 -
35
-
36
-
37
-
38
-
39
-
40
-
41
-
42
-
43
-
44
-
45
-
46
-
47
-
48
-
49
-
50
-
51
-
52
-
53
-
54
-
55
-
56
-
57
-
58
-
59
-
60
-
61
-
62
-
63
-
64
-
65
-
66
-
67
-
68
-
69
-
70
-
71
-
72
-
73
-
74
-
75
-
76
-
77
-
78
-
79
-
80
-
81
-
82
-
83
-
84
-
85
-
86
-
87
-
88
-
89
-
90
 |
 |

sales, first quarter 2001 margins were negatively impacted by the rebate programs and price cuts discussed above that decreased revenue by
approximately $138 million. Additionally, actual and forecasted declines in net sales caused the Company to recognize during the first quarter
of 2001 approximately $122 million of charges associated with purchase order cancellations and loss commitments for component purchases.
Without these charges, gross margin for the first quarter of 2001 would have been approximately 21%, and gross margin for all of 2001 would
have been approximately 27%. As a percentage of net sales, the Company's gross margin increased each quarter as 2001 progressed reaching
30% during the fourth quarter. This pattern reflects the favorable impact during 2001 of declining component costs, especially for DRAM, hard
drives, and flat panel screens.
Operating Expenses
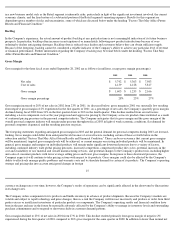
Operating expenses for the three fiscal years ended September 28, 2002 are as follows (in millions, except for percentages):
Research and Development (R&D)
The Company recognizes that focused investments in R&D are critical to its future growth and competitive position in the marketplace and are
directly related to timely development of new and enhanced products that are central to the Company's core business strategy. R&D expense
increased 4% or $16 million to $446 million in 2002 as compared to 2001. This followed a $50 million or 13% increase in 2001 as compared to
2000. The overall increase in R&D expense over the last two years relates primarily to increased R&D headcount and support for new product
development activities. R&D spending in 2002 also included capitalized software development costs of approximately $13.3 million associated
with the development of Mac OS X Jaguar and approximately $6 million associated with the new PowerSchool enterprise student information
system. R&D spending in 2001 also included capitalized software development costs of approximately $5.4 million associated with the
development of the original version of Mac OS X. Further information related to the Company's capitalization of software development costs
may be found in Part II, Item 8 of this Form 10-K at Note 1 of Notes to Consolidated Financial Statements.
Selling, General, and Administrative Expense (SG&A)
SG&A decreased $27 million or 2% during 2002 as compared to 2001. The decrease in SG&A in 2002 is primarily the result of lower
discretionary spending on marketing and advertising expenses, decreased spending related to information systems, and benefits directly related
to the Company's restructuring
28
actions in 2002 and 2001. These decreases were partially offset by higher sales expense in 2002 resulting from increased operating expenses
associated with expansion of the Company's Retail segment. SG&A expenditures decreased $28 million or 2% during 2001 as compared to
2000. Declines in SG&A spending in both 2002 and 2001 reflect the Company's overall efforts to stabilize and selectively reduce recurring
SG&A costs in light of lower net sales and to reduce discretionary marketing and advertising expenses. Given current economic conditions and
the Company's continued strategic investments in new product development and its Retail segment, the Company is currently identifying
additional opportunities to make appropriate reductions in SG&A costs.
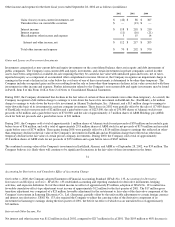
Special Charges Included in Operating Expenses
Special charges included in operating expense for the three fiscal years ended September 28, 2002 are as follows (in millions):
2002 Restructuring Actions
During fiscal 2002, the Company recorded total restructuring charges of $30 million related to actions intended to eliminate certain activities
and better align the Company's operating expenses with existing general economic conditions and to partially offset the cost of continuing
investments in new product development and investments in the Company's Retail operating segment. Once fully implemented, the Company
2002
2001
2000
Research and development
$
446
$
430
$
380
Percentage of net sales
8
%
8
%
5
%
Selling, general, and administrative expenses
$
1,111
$
1,138
$
1,166
Percentage of net sales
19
%
21
%
15
%
2002
2001
2000
Restructuring costs
$
30
—
$
8
Purchased in
-
process research and development
$
1
$
11
—
Executive bonus
$
(2
)
—
$
90