Apple 2002 Annual Report Download - page 41
Download and view the complete annual report
Please find page 41 of the 2002 Apple annual report below. You can navigate through the pages in the report by either clicking on the pages listed below, or by using the keyword search tool below to find specific information within the annual report.-
 1
1 -
2
-
3
-
4
-
5
-
6
-
7
-
8
-
9
-
10
-
11
-
12
-
13
-
14
-
15
-
16
-
17
-
18
-
19
-
20
-
21
-
22
-
23
-
24
-
25
-
26
-
27
-
28
-
29
-
30
-
 31
31 -
 32
32 -
 33
33 -
 34
34 -
 35
35 -
 36
36 -
 37
37 -
 38
38 -
 39
39 -
 40
40 -
 41
41 -
 42
42 -
 43
43 -
 44
44 -
 45
45 -
 46
46 -
 47
47 -
 48
48 -
 49
49 -
 50
50 -
 51
51 -
52
-
53
-
54
-
55
-
56
-
57
-
58
-
59
-
60
-
61
-
62
-
63
-
64
-
65
-
66
-
67
-
68
-
69
-
70
-
71
-
72
-
73
-
74
-
75
-
76
-
77
-
78
-
79
-
80
-
81
-
82
-
83
-
84
-
85
-
86
-
87
-
88
-
89
-
90
 |
 |

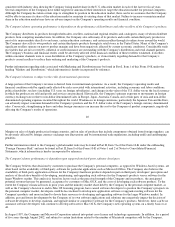
See accompanying notes to consolidated financial statements.
51
CONSOLIDATED STATEMENTS OF CASH FLOWS
(In millions)
Issuance of common stock and
assumption of stock options in
connection with acquisition — —
2,403
66
— (
13
) —
53
Amortization of acquisition-related
deferred stock compensation
—
—
—
—
—
2
—
2
Common stock issued under stock
option and purchase plans — —
3,660
42
— —
42
Conversion of Series A preferred stock
(76
)
(76
)
9,182
76
— — — —
Tax benefit related to stock options
—
—
—
7
—
—
—
7
Balances as of September 29, 2001 — $ —
350,922
$
1,693
$
2,260
$
(11
) $
(22
) $
3,920
Components of comprehensive income
(loss):
Net income (loss)
65
65
Foreign currency translation — — — — — —
5
5
Change in unrealized gain on
available-for-sale securities, net of
tax — — — — — — (
17
)
(17
)
Change in unrealized gain on
derivative investments, net of tax
—
—
—
—
—
—
(
15
)
(15
)
Total comprehensive income
(loss)
38
Amortization of acquisition-related
deferred stock compensation
—
—
—
—
—
4
—
4
Common stock issued under stock
option and purchase plans — —
8,037
105
— —
105
Tax benefit related to stock options
—
—
—
28
—
—
—
28
Balances as of September 28, 2002 — $ —
358,959
$
1,826
$
2,325
$
(7
) $
(49
) $
4,095
Three fiscal years ended September 28, 2002
2002
2001
2000
Cash and cash equivalents, beginning of the year
$
2,310
$
1,191
$
1,326
Operating:
Net income (loss)
65
(25
)
786
Cumulative effect of accounting change, net of taxes
—
(
12
)
—
Adjustments to reconcile net income to cash generated by operating activities:
Depreciation and amortization
118
102
84
Provision for deferred income taxes
(34
)
(36
)
163
Loss on disposition of property, plant, and equipment
7
9
10
(Gains) losses on investments, net
35
(88
)
(367
)
Unrealized loss on convertible securities
—
13
—
Purchased in
-
process research and development
1
11
—
Changes in operating assets and liabilities:
Accounts receivable
(99
)
487
(272
)
Inventories
(34
)
22
(13
)
Other current assets
(114
)
106
(37
)
Other assets
(11
)
12
20
Accounts payable
110
(356
)
318
Other current liabilities
45
(60
)
176
Cash generated by operating activities
89
185
868