Apple 2002 Annual Report Download - page 64
Download and view the complete annual report
Please find page 64 of the 2002 Apple annual report below. You can navigate through the pages in the report by either clicking on the pages listed below, or by using the keyword search tool below to find specific information within the annual report.-
 1
1 -
2
-
3
-
4
-
5
-
6
-
7
-
8
-
9
-
10
-
11
-
12
-
13
-
14
-
15
-
16
-
17
-
18
-
19
-
20
-
21
-
22
-
23
-
24
-
25
-
26
-
27
-
28
-
29
-
30
-
31
-
32
-
33
-
34
-
35
-
36
-
37
-
38
-
39
-
40
-
41
-
42
-
43
-
44
-
45
-
46
-
47
-
48
-
49
-
50
-
51
-
52
-
53
-
 54
54 -
 55
55 -
 56
56 -
 57
57 -
 58
58 -
 59
59 -
 60
60 -
 61
61 -
 62
62 -
 63
63 -
 64
64 -
 65
65 -
 66
66 -
 67
67 -
 68
68 -
 69
69 -
 70
70 -
 71
71 -
 72
72 -
 73
73 -
 74
74 -
75
-
76
-
77
-
78
-
79
-
80
-
81
-
82
-
83
-
84
-
85
-
86
-
87
-
88
-
89
-
90
 |
 |

81
Note 11—Segment Information and Geographic Data
The Company manages its business primarily on a geographic basis. The Company's reportable segments are comprised of the Americas,
Europe, Japan, and Retail. The Americas segment includes both North and South America, except for the activities of the Company's Retail
segment. The Europe segment includes European countries as well as the Middle East and Africa. The Japan segment includes only Japan. The
Retail segment operates Apple-owned retail stores in the United States. Other operating segments include Asia-Pacific, which includes
Australia and Asia except for Japan, and the Company's subsidiary, Filemaker, Inc. Each reportable geographic operating segment provides
similar products and services, and the accounting policies of the various segments are the same as those described in the Summary of
Significant Accounting Policies in Note 1, except as described below for the Retail segment.
The Company evaluates the performance of its operating segments based on net sales and operating income. Net sales for geographic segments
are based on the location of the customers. Operating income for each segment includes revenue from third-parties, cost of sales, and operating
expenses directly attributable to the segment. Operating income for each segment excludes other income and expense and certain expenses that
are managed outside the operating segments. Costs excluded from segment operating income include various corporate expenses,
manufacturing costs not included in standard costs, income taxes, and various nonrecurring charges. Corporate expenses include research and
development, corporate marketing expenses, and other separately managed general and administrative expenses including certain corporate
expenses associated with support of the Retail segment. The Company does not include intercompany transfers between segments for
management reporting purposes. Segment assets exclude corporate assets. Corporate assets include cash, short-term and long-
term investments,
manufacturing facilities, miscellaneous corporate infrastructure, goodwill and other acquired intangible assets, and retail store construction-in-
progress which is not subject to depreciation. Except for the Retail segment, capital expenditures for long-lived assets are not reported to
management by segment. Capital expenditures by the Retail segment were $106 million in 2002 and $92 million in 2001.
Operating income for all segments except Retail includes cost of sales at standard cost. Certain manufacturing expenses and related adjustments
not included in segment cost of sales, including variances between standard and actual manufacturing costs and the mark-up above standard
cost for product supplied to the Retail segment, are included in corporate expenses.
To assess the operating performance of the Retail segment several significant items are included in its results for internal management reporting
that are not included in results of the Company's other segments. First, cost of sales for the Retail segment includes a mark-up above the
Company's standard cost to approximate the price normally charged to the Company's major channel partners in the United States. For the
twelve-month period ended September 28, 2002 and September 29, 2001, this resulted in the recognition of additional cost of sales above
standard cost by the Retail segment and an offsetting benefit to corporate expenses of approximately $52 million and $4 million, respectively.
Second, the Retail segment includes in its net sales proceeds from sales of the Company's extended warranty and support contracts. This
treatment is consistent with how the Company's major channel partners account for the sale of the Company's extended warranty and support
contracts. Because the revenue from these contracts has yet to be earned by the Company, an offset to this amount is reflected as a decrease in
other segments' net sales. For the twelve-month period ended September 28, 2002, this resulted in the recognition of additional net sales by the
Retail segment, and an offsetting reduction to other segments' net sales of $4.8 million. This amount was insignificant in 2001. Third, a portion
of the operating expenses associated with certain high profile retail stores are allocated from the Retail segment to corporate marketing
expense. Allocation of these expenses reflects the unique nature of these stores which, given their larger size and extraordinary design
elements, function as vehicles for general corporate marketing, corporate events, and brand
82
awareness. Allocated operating costs are those in excess of operating costs incurred by one of the Company's more typical retail locations.
Stores were open in two such high profile locations in New York and Los Angeles as of September 28, 2002, both of which were opened in
fiscal 2002. Expenses allocated to corporate marketing resulting from the operations of these two stores was $1 million in 2002.
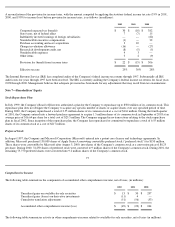
Summary information by operating segment follows (in millions):
2002
2001
2000
Americas:
Net sales
$
3,088
$
2,996
$
4,298
Operating income $
280
$
133
$
614
Depreciation and amortization $
4
$
4
$
5
Segment assets(a) $
395
$
334
$
618
Europe:
Net sales
$
1,251
$
1,249
$
1,817