Apple 2002 Annual Report Download - page 19
Download and view the complete annual report
Please find page 19 of the 2002 Apple annual report below. You can navigate through the pages in the report by either clicking on the pages listed below, or by using the keyword search tool below to find specific information within the annual report.-
 1
1 -
2
-
3
-
4
-
5
-
6
-
7
-
8
-
 9
9 -
 10
10 -
 11
11 -
 12
12 -
 13
13 -
 14
14 -
 15
15 -
 16
16 -
 17
17 -
 18
18 -
 19
19 -
 20
20 -
 21
21 -
 22
22 -
 23
23 -
 24
24 -
 25
25 -
 26
26 -
 27
27 -
 28
28 -
 29
29 -
30
-
31
-
32
-
33
-
34
-
35
-
36
-
37
-
38
-
39
-
40
-
41
-
42
-
43
-
44
-
45
-
46
-
47
-
48
-
49
-
50
-
51
-
52
-
53
-
54
-
55
-
56
-
57
-
58
-
59
-
60
-
61
-
62
-
63
-
64
-
65
-
66
-
67
-
68
-
69
-
70
-
71
-
72
-
73
-
74
-
75
-
76
-
77
-
78
-
79
-
80
-
81
-
82
-
83
-
84
-
85
-
86
-
87
-
88
-
89
-
90
 |
 |

21
requiring an impairment loss be recognized in the period such a determination is made. Additional information regarding these investments and
potential charges related to their impairment may be found below under the caption "Factors That May Affect Future Results and Financial
Condition."
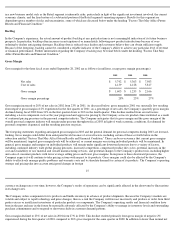
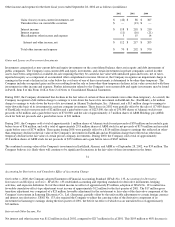
Net Sales
Net sales and Macintosh unit sales for geographic segments and by product follow (net sales in millions and Macintosh unit sales in
thousands):
(a)
2002
Change
2001
Change
2000
Americas net sales
$
3,088
3
%
$
2,996
(30
)%
$
4,298
Europe net sales
1,251
0
%
1,249
(31
)%
1,817
Japan net sales
710
0
%
713
(47
)%
1,345
Retail net sales
283
—
19
—
—
Other segments net sales
410
6
%
386
(26
)%
523
Total net sales $
5,742
7
% $
5,363
(33
)% $
7,983
Americas Macintosh unit sales
1,728
(2
)%
1,768
(29
)%
2,507
Europe Macintosh unit sales
722
(4
)%
754
(32
)%
1,110
Japan Macintosh unit sales
386
(2
)%
394
(46
)%
730
Retail Macintosh unit sales
92
—
7
—
—
Other segments Macintosh unit sales
173
5
%
164
(22
)%
211
Total Macintosh unit sales
3,101
0
%
3,087
(32
)%
4,558
Power Macintosh net sales (a)
$
1,380
(17
)%
$
1,664
(39
)%
$
2,747
PowerBook net sales
831
2
%
813
(14
)%
948
iMac net sales
1,448
30
%
1,117
(53
)%
2,381
iBook net sales
875
8
%
809
0
%
809
Software, Service, and Other net sales
1,208
26
%
960
(13
)%
1,098
Total net sales $
5,742
7
% $
5,363
(33
)% $
7,983
Power Macintosh unit sales (a)
766
(18
)%
937
(35
)%
1,436
PowerBook unit sales
357
3
%
346
(10
)%
383
iMac unit sales
1,301
8
%
1,208
(45
)%
2,194
iBook unit sales
677
14
%
596
9
%
545
Total Macintosh unit sales
3,101
0
%
3,087
(32
)%
4,558
Net sales per Macintosh unit sold (b)
$
1,462
$
1,426
$
1,510
Includes server sales and amounts previously reported as Power Macintosh G4 Cube.
(b) Based on net sales associated with Macintosh units and total Macintosh units sold.
Net sales increased $379 million or 7% during 2002 compared to 2001, while Macintosh unit sales were relatively flat year
-over-year at
approximately 3.1 million units. On a geographic basis, performance in the domestic market was relatively strong, especially when considering
the performance of the Company's Retail segment which currently operates exclusively in the United States. However, the European and
Japanese markets remained sluggish throughout 2002. The Company's net sales in 2002 were positively influenced by a number of factors.