Apple 2002 Annual Report Download - page 61
Download and view the complete annual report
Please find page 61 of the 2002 Apple annual report below. You can navigate through the pages in the report by either clicking on the pages listed below, or by using the keyword search tool below to find specific information within the annual report.-
 1
1 -
2
-
3
-
4
-
5
-
6
-
7
-
8
-
9
-
10
-
11
-
12
-
13
-
14
-
15
-
16
-
17
-
18
-
19
-
20
-
21
-
22
-
23
-
24
-
25
-
26
-
27
-
28
-
29
-
30
-
31
-
32
-
33
-
34
-
35
-
36
-
37
-
38
-
39
-
40
-
41
-
42
-
43
-
44
-
45
-
46
-
47
-
48
-
49
-
50
-
 51
51 -
 52
52 -
 53
53 -
 54
54 -
 55
55 -
 56
56 -
 57
57 -
 58
58 -
 59
59 -
 60
60 -
 61
61 -
 62
62 -
 63
63 -
 64
64 -
 65
65 -
 66
66 -
 67
67 -
 68
68 -
 69
69 -
 70
70 -
 71
71 -
72
-
73
-
74
-
75
-
76
-
77
-
78
-
79
-
80
-
81
-
82
-
83
-
84
-
85
-
86
-
87
-
88
-
89
-
90
 |
 |

$25,000 in any calendar year. During 2002, 2001, and 2000, 1.8 million, 1.8 million and 766,000 shares, respectively, were issued under the
Purchase Plan. As of September 28, 2002, approximately 2.1 million shares were reserved for future issuance under the Purchase Plan.
Employee Savings Plan
The Company has an employee savings plan (the Savings Plan) qualifying as a deferred salary arrangement under Section 401(k) of the
Internal Revenue Code. Under the Savings Plan, participating U.S. employees may defer a portion of their pre-tax earnings, up to the Internal
Revenue Service annual contribution limit ($11,000 for calendar year 2002). The Company matches 50% to 100% of each employee's
contributions, depending on length of service, up to a maximum 6% of the employee's earnings. The Company's matching contributions to the
Savings Plan were approximately $19 million, $17 million, and $16 million in 2002, 2001, and 2000, respectively.
77
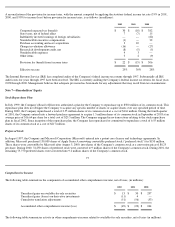
Stock Option Activity
A summary of the Company's stock option activity and related information for the years ended September 28, 2002, September 29, 2001 and
September 30, 2000 follows (option amounts are presented in thousands):
78
The options outstanding as of September 28, 2002, have been segregated into five ranges for additional disclosure as follows (option amounts
are presented in thousands):
Outstanding Options
Shares
Available
for Grant
Number of
Shares
Weighted Average
Exercise Price
Balance at 9/25/99
41,727
36,808
$
13.20
Additional Options Authorized
13,500
—
—
Options Granted
(45,662
)
45,662
$
46.52
Options Cancelled
4,846
(4,846
) $
28.42
Options Exercised
—
(
6,866
) $
9.62
Plan Shares Expired
(2,881
) —
—
Balance at 9/30/00
11,530
70,758
$
34.01
Additional Options Authorized
27,000
—
—
Options Granted
(34,857
)
34,857
$
18.58
Options Cancelled
6,605
(6,605
) $
29.32
Options Exercised
—
(
1,831
) $
10.05
Plan Shares Expired
(203
) —
—
Balance at 9/29/01
10,075
97,179
$
29.24
Additional Options Authorized
15,000
—
—
Options Granted
(23,239
)
23,239
$
19.89
Options Cancelled
4,737
(4,737
) $
30.98
Options Exercised
—
(
6,251
) $
11.99
Plan Shares Expired
(2
) —
—
Balance at 9/28/02
6,571
109,430
$
28.17
Options Outstanding
Options Exercisable
Options
Outstanding as of
September 28, 2002
Weighted-Average
Remaining Contractual
Life in Years
Weighted
Average
Exercise Price
Options
Exercisable as of
September 28,
2002
Weighted
Average
Exercise Price