Kohl's 2008 Annual Report Download - page 19
Download and view the complete annual report
Please find page 19 of the 2008 Kohl's annual report below. You can navigate through the pages in the report by either clicking on the pages listed below, or by using the keyword search tool below to find specific information within the annual report.-
 1
1 -
2
-
3
-
4
-
5
-
6
-
7
-
8
-
 9
9 -
 10
10 -
 11
11 -
 12
12 -
 13
13 -
 14
14 -
 15
15 -
 16
16 -
 17
17 -
 18
18 -
 19
19 -
 20
20 -
 21
21 -
 22
22 -
 23
23 -
 24
24 -
 25
25 -
 26
26 -
 27
27 -
 28
28 -
 29
29 -
30
-
31
-
32
-
33
-
34
-
35
-
36
-
37
-
38
-
39
-
40
-
41
-
42
-
43
-
44
-
45
-
46
-
47
-
48
-
49
-
50
-
51
-
52
-
53
-
54
-
55
-
56
-
57
-
58
-
59
-
60
-
61
-
62
-
63
-
64
-
65
-
66
-
67
-
68
-
69
-
70
-
71
-
72
-
73
-
74
-
75
-
76
-
77
-
78
-
79
-
80
-
81
 |
 |
Item 7. Management’s Discussion and Analysis of Financial Condition and Results of Operations
Executive Summary
Our 2008 net sales reflect the impact of reduced discretionary consumer spending as a result of the
slowdown in the U.S. economy. Partially offsetting the decrease in comparable store sales were the positive
results of strong inventory and expense management.
Total net sales for 2008 were $16 billion, a 0.5% decrease from 2007. Comparable store sales decreased
6.9% as the result of a 5.9% decrease in the number of transactions per store and a 1.0% decrease in average
transaction value. Accessories reported the strongest comparable store sales. The Northeast, Midwest and
Mid-Atlantic regions had the strongest comparable store sales for 2008.
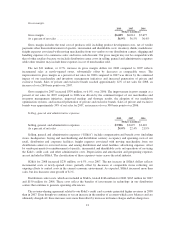
Gross margin as a percent of net sales was 36.9% for 2008, a 44 basis point improvement over 2007.
Conservative inventory management, lower levels of clearance inventory, and increased penetration of private
and exclusive brands contributed to the margin strength, despite the difficult economic environment. Inventory
per store at year-end 2008 decreased 9.3% compared to year-end 2007.
Selling, general and administrative expenses increased 6.5% over 2007. As expected, these expenses
increased more than sales, but less than new store growth of 8.1%.
Net income for 2008 was $885 million, or $2.89 per diluted share, compared with $1.1 billion or $3.39 per
diluted share for 2007.
As of year-end 2008, we operated 1,004 stores, with 75 million square feet of selling space, in 48 states
compared to 929 stores, with 70 million square feet of selling space, in 47 states as of year-end 2007. In 2009, we
are planning to open approximately 55 new stores. We are also planning to remodel 51 stores, an increase from
36 remodels in 2008.
We believe our capital structure is well positioned to continue to support our expansion plans. We expect
internally generated cash flows to continue to be our primary source of the funding required for future growth.
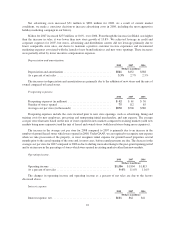
For 2009, we currently expect total sales to decrease in the range of 4% to 1% and comparable store sales to
decrease in the range of 8% to 5% compared to 2008. We currently expect gross margin as a percentage of sales
to be flat to up 10 basis points over 2008 and SG&A expense to increase 3% to 4% over 2008. Achieving these
expectations would result in earnings per diluted share in the range of $2.00 to $2.30 for fiscal 2009.
Results of Operations
Our fiscal year ends on the Saturday closest to January 31. Unless otherwise noted, references to years in
this report relate to fiscal years, rather than to calendar years. Fiscal year 2008 (“2008”) ended on January 31,
2009 and was a 52-week year. Fiscal year 2007 (“2007”) ended on February 2, 2008 and was a 52-week year.
Fiscal year 2006 (“2006”) ended on February 3, 2007 and was a 53-week year.
19