Kohl's 2008 Annual Report Download - page 54
Download and view the complete annual report
Please find page 54 of the 2008 Kohl's annual report below. You can navigate through the pages in the report by either clicking on the pages listed below, or by using the keyword search tool below to find specific information within the annual report.-
 1
1 -
2
-
3
-
4
-
5
-
6
-
7
-
8
-
9
-
10
-
11
-
12
-
13
-
14
-
15
-
16
-
17
-
18
-
19
-
20
-
21
-
22
-
23
-
24
-
25
-
26
-
27
-
28
-
29
-
30
-
31
-
32
-
33
-
34
-
35
-
36
-
37
-
38
-
39
-
40
-
41
-
42
-
43
-
 44
44 -
 45
45 -
 46
46 -
 47
47 -
 48
48 -
 49
49 -
 50
50 -
 51
51 -
 52
52 -
 53
53 -
 54
54 -
 55
55 -
 56
56 -
 57
57 -
 58
58 -
 59
59 -
 60
60 -
 61
61 -
 62
62 -
 63
63 -
 64
64 -
65
-
66
-
67
-
68
-
69
-
70
-
71
-
72
-
73
-
74
-
75
-
76
-
77
-
78
-
79
-
80
-
81
 |
 |

KOHL’S CORPORATION
NOTES TO CONSOLIDATED FINANCIAL STATEMENTS—(Continued)
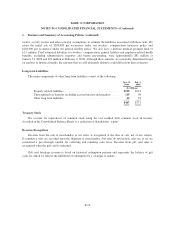
2. Long-term Investments (continued)
model used unique inputs for each security including discount rate, interest rate currently being paid and
maturity. The discount rate was calculated using the closest match available for other insured asset backed
securities. A market failure scenario was employed as recent successful auctions of these securities were very
limited.
The following table presents a rollforward of our ARS, all of which are measured at fair value on a recurring
basis using unobservable inputs (Level 3):
(In Millions)
Balance as of February 3, 2008 ...................................... $—
Transfers into Level 3 ............................................. 424
Sales (at par) ..................................................... (17)
Unrealized losses ................................................. (75)
Balance as of January 31, 2009 ...................................... $332
The $75 million of unrealized losses presented in the table above are reported net of deferred taxes of $29
million as a component of Accumulated Other Comprehensive Loss in the Consolidated Statement of
Shareholders’ Equity.
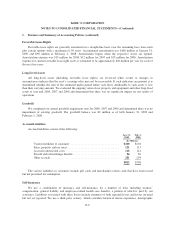
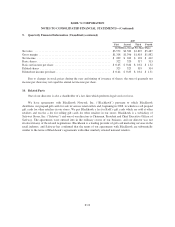
3. Debt
Long-term debt consists of the following:
Maturing
Weighted
Average
Effective
Rate
Jan. 31,
2009
Feb. 2,
2008
($ in Millions)
Non-callable and unsecured senior debt:
2011 ................................................ 6.59% $ 400 $ 400
2017 ................................................ 6.31% 650 650
2029 ................................................ 7.36% 200 200
2033 ................................................ 6.05% 300 300
2037 ................................................ 6.89% 350 350
Total senior debt ........................................... 6.55% 1,900 1,900
Capital lease obligations .................................... 177 172
Unamortized debt discount .................................. (7) (7)
Less current portion ........................................ (17) (13)
Long-term debt and capital leases ............................. $2,053 $2,052
On September 28, 2007, we issued $1 billion of non-callable unsecured debt, which included $650 million
in aggregate principal amount of 6.25% Notes due 2017 and $350 million in aggregate principal amount of
6.875% Notes due 2037. Interest-only payments are due on these notes semi-annually on June 15 and
December 15 beginning in June 2008. The notes are subject to various customary covenants.
Based on quoted market prices, the estimated fair value of our senior debt was approximately $1.6 billion at
January 31, 2009 and $1.9 billion at February 2, 2008.
F-15