Kohl's 2008 Annual Report Download - page 27
Download and view the complete annual report
Please find page 27 of the 2008 Kohl's annual report below. You can navigate through the pages in the report by either clicking on the pages listed below, or by using the keyword search tool below to find specific information within the annual report.-
 1
1 -
2
-
3
-
4
-
5
-
6
-
7
-
8
-
9
-
10
-
11
-
12
-
13
-
14
-
15
-
16
-
 17
17 -
 18
18 -
 19
19 -
 20
20 -
 21
21 -
 22
22 -
 23
23 -
 24
24 -
 25
25 -
 26
26 -
 27
27 -
 28
28 -
 29
29 -
 30
30 -
 31
31 -
 32
32 -
 33
33 -
 34
34 -
 35
35 -
 36
36 -
 37
37 -
38
-
39
-
40
-
41
-
42
-
43
-
44
-
45
-
46
-
47
-
48
-
49
-
50
-
51
-
52
-
53
-
54
-
55
-
56
-
57
-
58
-
59
-
60
-
61
-
62
-
63
-
64
-
65
-
66
-
67
-
68
-
69
-
70
-
71
-
72
-
73
-
74
-
75
-
76
-
77
-
78
-
79
-
80
-
81
 |
 |

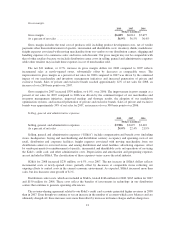
The increase in working capital and the current ratio as of year-end 2007 compared to year-end 2006 was
primarily due to higher inventories and short-term investments and decreases in accounts payable and taxes
payable. The increase in the debt/capitalization ratio represents higher debt levels, partially offset by higher
capitalization. The higher debt levels reflect the $1 billion of long-term notes that were issued in September
2007. The higher capitalization is the result of earnings and stock option exercises, partially offset by share
repurchases. The decrease in the earnings to fixed charges ratio was the result of lower income before taxes,
including higher interest expense on our debt and higher rent expense attributable to interest.
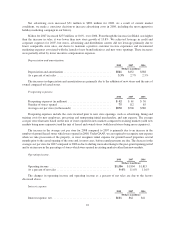
Debt Covenant Compliance. Our debt agreements contain various covenants including limitations on
additional indebtedness and the following leverage ratio:
(Dollars in
Millions)
Total Debt per Balance Sheet .................................... $ 2,070
Other Debt ................................................... —
Subtotal ..................................................... 2,070
Rent x 8 ..................................................... 3,580
A Included Indebtedness .......................................... $ 5,650
Net Worth .................................................... $ 6,739
Investments (accounted for under equity method) .................... —
Subtotal ..................................................... 6,739
Included Indebtedness .......................................... 5,650
B Capitalization ................................................. $12,389
Leverage Ratio (A/B) ........................................... 0.46
Maximum permitted Leverage Ratio ............................... 0.70
As of January 31, 2009, we were in compliance with all debt covenants and expect to remain in compliance
during fiscal 2009.
Free Cash Flow. Free cash flow is a non-GAAP financial measure which we define as net cash provided by
operating activities less capital expenditures. Free cash flow should be evaluated in addition to, and not
considered a substitute for, other financial measures such as net income and cash flow provided by operations.
We believe that free cash flow represents our ability to generate additional cash flow from our business
operations.
The following table reconciles net cash provided by operating activities, a GAAP measure, to free cash
flow, a non-GAAP measure.
2008 2007 2006
(In Millions)
Net cash provided by operating activities ...................... $ 1,701 $ 1,235 $ 3,120
Acquisition of property and equipment and favorable lease rights . . . (1,014) (1,542) (1,163)
Free cash flow ........................................... $ 687 $ (307) $ 1,957
27