Kohl's 2008 Annual Report Download - page 22
Download and view the complete annual report
Please find page 22 of the 2008 Kohl's annual report below. You can navigate through the pages in the report by either clicking on the pages listed below, or by using the keyword search tool below to find specific information within the annual report.-
 1
1 -
2
-
3
-
4
-
5
-
6
-
7
-
8
-
9
-
10
-
11
-
 12
12 -
 13
13 -
 14
14 -
 15
15 -
 16
16 -
 17
17 -
 18
18 -
 19
19 -
 20
20 -
 21
21 -
 22
22 -
 23
23 -
 24
24 -
 25
25 -
 26
26 -
 27
27 -
 28
28 -
 29
29 -
 30
30 -
 31
31 -
 32
32 -
33
-
34
-
35
-
36
-
37
-
38
-
39
-
40
-
41
-
42
-
43
-
44
-
45
-
46
-
47
-
48
-
49
-
50
-
51
-
52
-
53
-
54
-
55
-
56
-
57
-
58
-
59
-
60
-
61
-
62
-
63
-
64
-
65
-
66
-
67
-
68
-
69
-
70
-
71
-
72
-
73
-
74
-
75
-
76
-
77
-
78
-
79
-
80
-
81
 |
 |

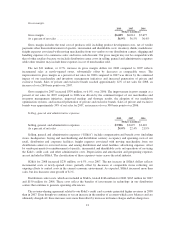
Net advertising costs increased $51 million to $890 million for 2008. As a result of current market
conditions, we made a conscious decision to increase advertising costs in 2008, including the most aggressive
holiday marketing campaign in our history.
SG&A for 2007 increased $275 million, or 8.0%, over 2006. Even though the increase in SG&A was higher
than the increase in sales, it was lower than new store growth of 13.8%. We achieved leverage in credit and
corporate expenses for 2007, but stores, advertising and distribution centers did not leverage primarily due to
lower comparable store sales, our desire to maintain a positive customer in-store experience and incremental
marketing expenses associated with the launch of new brand initiatives and new store openings. These increases
were partially offset by lower incentive compensation expenses.
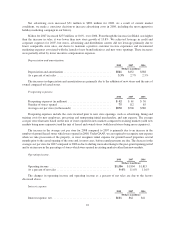
Depreciation and amortization.
2008 2007 2006
(Dollars in millions)
Depreciation and amortization ................................. $541 $452 $388
As a percent of net sales ...................................... 3.3% 2.7% 2.5%
The increases in depreciation and amortization are primarily due to the addition of new stores and the mix of
owned compared to leased stores.
Preopening expenses.
2008 2007 2006
Preopening expenses (in millions) .............................. $42 $61 $50
Number of stores opened ..................................... 75 112 85
Average cost per store (in thousands) ........................... $570 $500 $580
Preopening expenses include the costs incurred prior to new store openings, such as advertising, hiring and
training costs for new employees, processing and transporting initial merchandise, and rent expense. The average
cost per store fluctuates based on the mix of stores opened in new markets compared to existing markets (with new
markets being more expensive) and the mix of leased and owned stores (with leased stores being more expensive).
The increase in the average cost per store for 2008 compared to 2007 is primarily due to an increase in the
number of ground leased stores which were opened in 2008. Under GAAP, we are required to recognize rent expense
when we take possession of the property, so must recognize rental expense for ground leased properties several
months prior to the actual opening of the store and, in most cases, before rental payments are due. The decrease in the
average cost per store for 2007 compared to 2006 is due to shifting more advertising to the post-grand opening period
and to an increase in the percentage of stores which were opened in existing markets rather than new markets.
Operating income.
2008 2007 2006
(Dollars in millions)
Operating income ........................................... $1,536 $1,804 $1,815
As a percent of net sales ...................................... 9.4% 11.0% 11.6%
The changes in operating income and operating income as a percent of net sales are due to the factors
discussed above.
Interest expense.
2008 2007 2006
(Dollars in millions)
Interest expense, net ......................................... $111 $62 $41
22