Kohl's 2008 Annual Report Download - page 47
Download and view the complete annual report
Please find page 47 of the 2008 Kohl's annual report below. You can navigate through the pages in the report by either clicking on the pages listed below, or by using the keyword search tool below to find specific information within the annual report.-
 1
1 -
2
-
3
-
4
-
5
-
6
-
7
-
8
-
9
-
10
-
11
-
12
-
13
-
14
-
15
-
16
-
17
-
18
-
19
-
20
-
21
-
22
-
23
-
24
-
25
-
26
-
27
-
28
-
29
-
30
-
31
-
32
-
33
-
34
-
35
-
36
-
 37
37 -
 38
38 -
 39
39 -
 40
40 -
 41
41 -
 42
42 -
 43
43 -
 44
44 -
 45
45 -
 46
46 -
 47
47 -
 48
48 -
 49
49 -
 50
50 -
 51
51 -
 52
52 -
 53
53 -
 54
54 -
 55
55 -
 56
56 -
 57
57 -
58
-
59
-
60
-
61
-
62
-
63
-
64
-
65
-
66
-
67
-
68
-
69
-
70
-
71
-
72
-
73
-
74
-
75
-
76
-
77
-
78
-
79
-
80
-
81
 |
 |

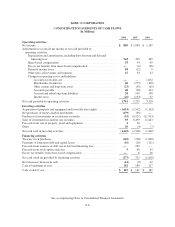
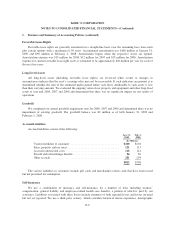
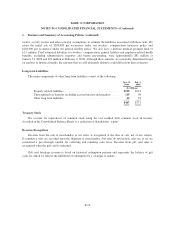
KOHL’S CORPORATION
NOTES TO CONSOLIDATED FINANCIAL STATEMENTS—(Continued)
1. Business and Summary of Accounting Policies (continued)
and the resulting gross margins are calculated by applying a cost-to-retail ratio to the retail value inventory. RIM
is an averaging method that has been widely used in the retail industry due to its practicality. The use of RIM will
result in inventory being valued at the lower of cost or market since permanent markdowns are currently taken as
a reduction of the retail value of inventory. We record an additional reserve when the future estimated selling
price is less than cost.
Property and Equipment
Property and equipment consist of the following:
Jan. 31,
2009
Feb. 2,
2008
(In Millions)
Land .................................................... $ 997 $ 871
Buildings and improvements ................................. 5,490 4,860
Store fixtures and equipment ................................. 2,135 1,954
Property under capital leases ................................. 233 214
Construction in progress ..................................... 257 353
Capitalized software ........................................ 337 288
Total property and equipment ................................ 9,449 8,540
Less accumulated depreciation ................................ (2,465) (2,030)
$ 6,984 $ 6,510
Construction in progress includes land and buildings and improvements for locations not yet opened and for
the expansion and remodeling of existing locations in process at the end of each year.
Property and equipment is recorded at cost, less accumulated depreciation. Depreciation is calculated using
the straight-line method over the estimated useful lives of the assets. Property rights under capital leases and
improvements to leased property are amortized on a straight-line basis over the term of the lease or useful life of
the asset, whichever is less. Depreciation expense for property and equipment, including property under capital
leases and capitalized software, totaled $528 million for 2008, $441 million for 2007 and $375 million for 2006.
The annual provisions for depreciation and amortization generally use the following ranges of useful lives:
Buildings and improvements ........................................ 8-40 years
Store fixtures and equipment ........................................ 3-15 years
Property under capital leases ........................................ 5-40 years
Computer hardware and software ..................................... 3-8years
Property and equipment acquired through capital leases totaled $18 million in 2008, $29 million in 2007 and
$14 million in 2006.
Capitalized Interest
We capitalize interest on the acquisition and construction of new locations and expansion of existing
locations and depreciate that amount over the lives of the related assets. Capitalized interest was $8 million for
2008, $16 million for 2007 and $8 million for 2006.
F-8