Kohl's 2008 Annual Report Download - page 25
Download and view the complete annual report
Please find page 25 of the 2008 Kohl's annual report below. You can navigate through the pages in the report by either clicking on the pages listed below, or by using the keyword search tool below to find specific information within the annual report.-
 1
1 -
2
-
3
-
4
-
5
-
6
-
7
-
8
-
9
-
10
-
11
-
12
-
13
-
14
-
 15
15 -
 16
16 -
 17
17 -
 18
18 -
 19
19 -
 20
20 -
 21
21 -
 22
22 -
 23
23 -
 24
24 -
 25
25 -
 26
26 -
 27
27 -
 28
28 -
 29
29 -
 30
30 -
 31
31 -
 32
32 -
 33
33 -
 34
34 -
 35
35 -
36
-
37
-
38
-
39
-
40
-
41
-
42
-
43
-
44
-
45
-
46
-
47
-
48
-
49
-
50
-
51
-
52
-
53
-
54
-
55
-
56
-
57
-
58
-
59
-
60
-
61
-
62
-
63
-
64
-
65
-
66
-
67
-
68
-
69
-
70
-
71
-
72
-
73
-
74
-
75
-
76
-
77
-
78
-
79
-
80
-
81
 |
 |

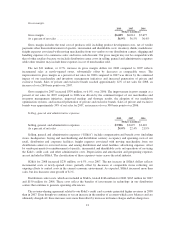
Capital expenditures include costs for new store openings, store remodels, distribution center openings and
other base capital needs. Capital expenditures totaled $1.0 billion for 2008, a $528 million decrease from 2007.
This decrease is primarily due to a decrease in the number of new store openings in 2008 compared to 2007. We
opened 75 stores in 2008 compared to 112 stores in 2007. Total capital expenditures for fiscal 2009 are expected
to be approximately $800 million. The actual amount of our future capital expenditures will depend primarily on
the number of new stores opened, the mix of owned, leased or acquired stores, the number of stores remodeled
and the timing of distribution center openings. We do not anticipate that our expansion plans will be limited by
any restrictive covenants in our financing agreements. We believe that our capital structure is well positioned to
support our expansion plans. We anticipate that internally generated cash flows will be the primary source of
funding for future growth.
Capital expenditures, including favorable lease rights, by major category were as follows:
2008 2007 2006
New stores ....................................................... 68% 77% 76%
Remodels / relocations .............................................. 12 62
Distribution centers ................................................ 436
Other ............................................................ 16 14 16
Acquisition of property and equipment and favorable lease rights ............ 100% 100% 100%
Net cash used in investing activities increased $128 million for 2007 compared to 2006. The increase
reflects higher capital expenditures, partially offset by the net impact of short-term investing activities. Net short-
term investment activity resulted in a use of funds of $52 million in 2007 and $270 million in 2006. Net short-
term investment activity reflects investment funds used to purchase treasury stock and the investment of proceeds
from the $1 billion of new debt issued in September 2007 and the sale of our private label credit card portfolio in
2006. Capital expenditures totaled $1.5 billion for 2007, a $379 million increase over 2006 primarily due to an
increase in the number of stores opened and an increase in the number of remodels.
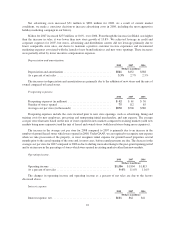
Financing activities.
Our financing activities used cash of $273 million in 2008 and provided cash of $325 million in 2007. The
change reflects the proceeds from issuance of debt in 2007 and lower treasury stock repurchases in 2008.
We have various facilities upon which we may draw funds, including a $900 million senior unsecured
revolving facility and two demand notes with aggregate availability of $50 million. The $900 million revolving
facility expires in October 2011. The co-leads of this facility, The Bank of New York Mellon and Bank of
America, have each committed $100 million. The remaining 12 lenders have each committed between $30 and
$130 million.
We had no amounts outstanding on our lines of credit at either year-end 2008 or year-end 2007. Average
borrowings under these facilities were $40 million for 2008, $63 million for 2007 and $19 million for 2006. The
decrease from 2007 to 2008 reflects decreased cash needs due to lower inventory levels, capital expenditures and
stock repurchases.
Our credit ratings have been unchanged since September 2007 when we issued $1 billion in debt. Our
ratings are currently as follows:
Moody’s
Standard
& Poor’s Fitch
Long-term debt .................................... Baa1 BBB+ BBB+
25