Kohl's 2008 Annual Report Download - page 26
Download and view the complete annual report
Please find page 26 of the 2008 Kohl's annual report below. You can navigate through the pages in the report by either clicking on the pages listed below, or by using the keyword search tool below to find specific information within the annual report.-
 1
1 -
2
-
3
-
4
-
5
-
6
-
7
-
8
-
9
-
10
-
11
-
12
-
13
-
14
-
15
-
 16
16 -
 17
17 -
 18
18 -
 19
19 -
 20
20 -
 21
21 -
 22
22 -
 23
23 -
 24
24 -
 25
25 -
 26
26 -
 27
27 -
 28
28 -
 29
29 -
 30
30 -
 31
31 -
 32
32 -
 33
33 -
 34
34 -
 35
35 -
 36
36 -
37
-
38
-
39
-
40
-
41
-
42
-
43
-
44
-
45
-
46
-
47
-
48
-
49
-
50
-
51
-
52
-
53
-
54
-
55
-
56
-
57
-
58
-
59
-
60
-
61
-
62
-
63
-
64
-
65
-
66
-
67
-
68
-
69
-
70
-
71
-
72
-
73
-
74
-
75
-
76
-
77
-
78
-
79
-
80
-
81
 |
 |

We may from time to time seek to retire or purchase our outstanding debt through open market cash
purchases, privately negotiated transactions or otherwise. Such repurchases, if any, will depend on prevailing
market conditions, our liquidity requirements, contractual restrictions and other factors. The amounts involved
could be material.
In September 2007, our Board of Directors authorized a $2.5 billion share repurchase program which is
intended to return excess capital to our shareholders. As a result of the current economic environment, we have
temporarily discontinued repurchases under this program. We will continue to evaluate stock repurchases based
on market conditions and our liquidity position, but do not currently expect any share repurchases in 2009. When
share repurchases are resumed, we expect to continue executing this share repurchase program primarily in open
market transactions, subject to market conditions.
Total repurchases under the repurchase plans were as follows:
2008 2007 2006 Total
$2.5 Billion Program:
Shares (in thousands) ........................ 6,048 7,409 — 13,457
Cost (in millions) ............................ $ 261 $ 372 — $ 633
Cost Per Share .............................. $43.19 $ 50.24 — $ 47.07
$2 Billion Program:
Shares (in thousands) ........................ —5,334 27,466 32,800
Cost (in millions) ............................ —$ 373 $ 1,627 $ 2,000
Cost Per Share .............................. —$ 69.97 $ 59.22 $ 60.97
Total:
Shares (in thousands) ........................ 6,048 12,743 27,466 46,257
Cost (in millions) ............................ $ 261 $ 745 $ 1,627 $ 2,633
Cost Per Share .............................. $43.19 $ 58.50 $ 59.22 $ 56.93
We also acquire shares from employees in lieu of amounts required to satisfy minimum tax withholding
requirements upon the vesting of the employee’s restricted stock. Such shares are then designated as treasury
shares.
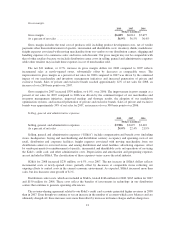
Our financing activities generated $325 million of cash in 2007, compared to using $1.6 billion in 2006. The
change is the result of proceeds from the issuance of debt in 2007 and lower treasury stock purchases in 2007.
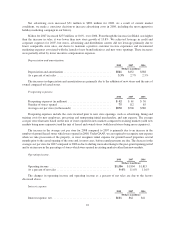
Key financial ratios.
Key financial ratios that provide certain measures of our liquidity are as follows:
2008 2007 2006
Working capital (In Millions) ................................ $ 1,885 $ 1,953 $ 1,482
Current ratio ............................................. 2.04:1 2.10:1 1.78:1
Debt/capitalization ........................................ 23.5% 25.3% 15.9%
Ratio of earnings to fixed charges ............................ 4.47 5.97 7.61
The decreases in working capital and the current ratio as of year-end 2008 compared to year-end 2007 were
primarily due to lower inventory levels and a higher accounts payable balance.
The debt/capitalization ratio reflects higher capitalization at year-end 2008 compared to year-end 2007 due
to current year earnings.
The decrease in the earnings to fixed charges ratio was the result of lower income before taxes and higher
interest expense on our debt due to the $1 billion in debt that was issued in September 2007.
26