LabCorp 2013 Annual Report Download - page 12
Download and view the complete annual report
Please find page 12 of the 2013 LabCorp annual report below. You can navigate through the pages in the report by either clicking on the pages listed below, or by using the keyword search tool below to find specific information within the annual report.-
 1
1 -
 2
2 -
 3
3 -
 4
4 -
 5
5 -
 6
6 -
 7
7 -
 8
8 -
 9
9 -
 10
10 -
 11
11 -
 12
12 -
 13
13 -
 14
14 -
 15
15 -
 16
16 -
 17
17 -
 18
18 -
 19
19 -
 20
20 -
 21
21 -
 22
22 -
23
-
24
-
25
-
26
-
27
-
28
-
29
-
30
-
31
-
32
-
33
-
34
-
35
-
36
-
37
-
38
-
39
-
40
-
41
-
42
-
43
-
44
-
45
-
46
-
47
-
48
-
49
-
50
-
51
-
52
-
53
-
54
-
55
-
56
-
57
-
58
 |
 |

8
LABORATORY CORPORATION OF AMERICA
Management’s Discussion and Analysis
of Financial Condition and Results of Operations (in millions)
General
Net sales for 2013 increased 2.4% in comparison to 2012 on a 4.0%
increase in volume and a 1.6% decrease in revenue per requisition.
The Company’s acquisition of MEDTOX on July 31, 2012 increased
revenue and volume by 1.6% and 2.1%, respectively, in 2013 com-
pared to 2012 and 1.0% and 1.4%, respectively, in 2012 compared
to 2011. The Company’s acquisition of Orchid in December 2011
increased revenue and volume by 1.1% and 0.3%, respectively, in
2012 compared to 2011.
During 2013, government payment reductions and molecular
pathology payment issues reduced the Company’s year over year
margins by approximately 150 basis points, reduced year over year
revenue per requisition by approximately 2% and reduced year
over year operating flow by more than an estimated $100.0. Also,
growth in the Company’s toxicology business reduced 2013 year
over year revenue per requisition by approximately 1%.
During 2013, the impact of weather reduced the Company’s
revenues and diluted earnings per share by an estimated $12.7 and
$0.07, respectively. During 2012, the impact of weather (notably
from Super Storm Sandy in October 2012) reduced the Company’s
revenues and diluted earnings per share by an estimated $16.0 and
$0.09, respectively.
The Company has seen growth in the amount of its patient
accounts receivable. A significant portion of the Company’s bad
debt expense is related to accounts receivable from patients. The
Company believes its current allowance for doubtful accounts is
sufficient to properly record its accounts receivable at their estimated
net realizable value. Should this shift towards increased patient
responsibility continue, the Company may need to increase its
allowance for doubtful accounts and bad debt expense in
future periods.
The Company manages its operations through two reportable
segments: the Clinical diagnostics laboratory segment, which includes
core testing as well as genomic and esoteric testing, and the Other
segment, comprised of the Company’s non-U.S. clinical diagnostic
laboratory operations in Ontario, Canada, which is reviewed sepa-
rately by corporate management for the purposes of allocation of
resources. As mentioned above, the Clinical diagnostics laboratory
segment results of operations have been negatively impacted by
the reductions in payments for laboratory services, primarily from
federal and state government entities. Operating results for the
Other segment have declined slightly as compared to 2012, pri-
marily due to the expansion of that segment through acquisitions
not fully integrated and synergies not fully realized, as well as the
impact of the stronger U.S. dollar in 2013 as compared with 2012.
Seasonality
The majority of the Company’s testing volume is dependent on
patient visits to physician offices and other providers of health care.
Volume of testing generally declines during the year-end holiday
periods and other major holidays. In addition, volume declines due
to inclement weather may reduce net revenues and cash flows.
Therefore, comparison of the results of successive periods may not
accurately reflect trends or results from one year to the next.
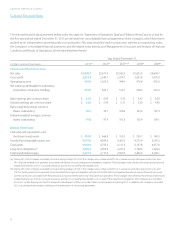
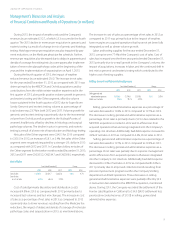
Results of Operations
(amounts in millions except Revenue Per Requisition info)
Years ended December 31, 2013, 2012, and 2011
Net Sales
Years Ended December 31, Change
2013 2012 2011 2013 2012
Net Sales
Clinical diagnostics laboratory:
Core Testing $ 3,445.1 $ 3,246.6 $ 3,143.9 6.1% 3.3%
Genomic and
Esoteric Testing 2,020.1 2,089.8 2,089.0 (3.3)% 0.0%
Other 343.1 335.0 309.4 2.4% 8.3%
Total $ 5,808.3 $ 5,671.4 $ 5,542.3 2.4% 2.3%
Years Ended December 31, Change
2013 2012 2011 2013 2012
Volume
Clinical diagnostics laboratory:
Core Testing 89.9 86.2 85.2 4.4% 1.2%
Genomic and
Esoteric Testing 31.2 29.9 29.3 4.3% 1.8%
Other 9.9 9.8 9.3 0.7% 6.2%
Total 131.0 125.9 123.8 4.0% 1.7%
Years Ended December 31, Change
2013 2012 2011 2013 2012
Revenue Per Requisition
Clinical diagnostics laboratory:
Core Testing $ 38.31 $ 37.68 $ 36.91 1.7% 2.1%
Genomic and
Esoteric Testing 64.84 69.94 71.19 (7.3)% (1.8)%
Other 34.53 33.94 33.29 1.7% 2.0%
Total $ 44.33 $ 45.04 $ 44.76 (1.6)% 0.6%
The increase in net sales for the three years ended December 31,
2013 has been driven primarily by acquisitions made in all years in
both of the Company’s segments, along with growth in the Company’s
managed care business and toxicology testing.