LabCorp 2013 Annual Report Download - page 33
Download and view the complete annual report
Please find page 33 of the 2013 LabCorp annual report below. You can navigate through the pages in the report by either clicking on the pages listed below, or by using the keyword search tool below to find specific information within the annual report.-
 1
1 -
2
-
3
-
4
-
5
-
6
-
7
-
8
-
9
-
10
-
11
-
12
-
13
-
14
-
15
-
16
-
17
-
18
-
19
-
20
-
21
-
22
-
 23
23 -
 24
24 -
 25
25 -
 26
26 -
 27
27 -
 28
28 -
 29
29 -
 30
30 -
 31
31 -
 32
32 -
 33
33 -
 34
34 -
 35
35 -
 36
36 -
 37
37 -
 38
38 -
 39
39 -
 40
40 -
 41
41 -
 42
42 -
 43
43 -
44
-
45
-
46
-
47
-
48
-
49
-
50
-
51
-
52
-
53
-
54
-
55
-
56
-
57
-
58
 |
 |

29
LABORATORY CORPORATION OF AMERICA
Notes to Consolidated Financial Statements
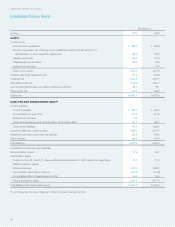
Concentration of Credit Risk
Financial instruments that potentially subject the Company to
concentrations of credit risk consist primarily of cash and cash
equivalents and accounts receivable.
The Company maintains cash and cash equivalents with various
major financial institutions. The total cash balances on deposit that
exceeded the balances insured by the F.D.I.C., were approximately
$52.8 at December 31, 2013. Cash equivalents at December 31, 2013,
totaled $367.5, which includes amounts invested in money market
funds, time deposits, municipal, treasury and government funds.
Substantially all of the Company’s accounts receivable are with
companies in the health care industry and individuals. However,
concentrations of credit risk are limited due to the number of the
Company’s clients as well as their dispersion across many different
geographic regions.
While the Company has receivables due from federal and
state governmental agencies, the Company does not believe that
such receivables represent a credit risk since the related healthcare
programs are funded by federal and state governments, and
payment is primarily dependent upon submitting appropriate
documentation. Accounts receivable balances (gross) from
Medicare and Medicaid were $128.6 and $121.1 at December 31,
2013 and 2012, respectively.
For the Company’s subsidiary operations in Ontario, Canada,
the Ministry of Health determines who can establish a licensed
community medical laboratory and caps the amount that each of
these licensed laboratories can bill the government sponsored
healthcare plan. The Ontario government-sponsored healthcare
plan covers the cost of clinical laboratory testing performed by the
licensed laboratories. The provincial government discounts the
annual testing volumes based on certain utilization discounts and
establishes an annual maximum it will pay for all community
laboratory tests. The agreed-upon reimbursement rates are subject
to Ministry of Health review at the end of the year and can be
adjusted (at the government’s discretion) based upon the actual
volume and mix of test work performed by the licensed providers
in the province during the year. The accounts receivable balances
from the Ontario government sponsored healthcare plan was
$33.2 and $26.7 at December 31, 2013 and 2012, respectively.
The portion of the Company’s accounts receivable due from
patients comprises the largest portion of credit risk. At December 31,
2013 and 2012, receivables due from patients represent approx-
imately 27.8% and 28.3% of the Company’s consolidated gross
accounts receivable. The Company applies assumptions and
judgments including historical collection experience for assessing
collectibility and determining allowances for doubtful accounts for
accounts receivable from patients.
Earnings per Share
Basic earnings per share is computed by dividing net earnings
attributable to Laboratory Corporation of America Holdings by the
weighted average number of common shares outstanding. Diluted
earnings per share is computed by dividing net earnings including
the impact of dilutive adjustments by the weighted average number
of common shares outstanding plus potentially dilutive shares, as
if they had been issued at the earlier of the date of issuance or the
beginning of the period presented. Potentially dilutive common
shares result primarily from the Company’s outstanding stock
options, restricted stock awards, performance share awards, and
shares issuable upon conversion of zero-coupon subordinated notes.
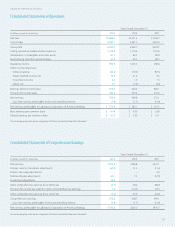
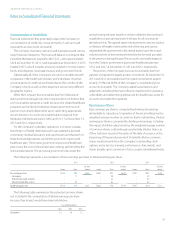
The following represents a reconciliation of basic earnings per share to diluted earnings per share:
2013 2012 2011
Per Share Per Share Per Share
Income Shares Amount Income Shares Amount Income Shares Amount
Basic earnings per share $ 573.8 90.2 $ 6.36 $ 583.1 95.7 $ 6.09 $ 519.7 100.0 $ 5.20
Stock options – 1.1 – 0.8 – 0.9
Restricted stock awards and other – – – 0.3 – 0.3
Effect of convertible debt, net of tax – 0.5 – 0.6 – 0.6
Diluted earnings per share $ 573.8 91.8 $ 6.25 $ 583.1 97.4 $ 5.99 $ 519.7 101.8 $ 5.11
The following table summarizes the potential common shares
not included in the computation of diluted earnings per share
because their impact would have been antidilutive:
Years Ended December 31,
2013 2012 2011
Stock options 0.1 2.4 1.3