LabCorp 2013 Annual Report Download - page 40
Download and view the complete annual report
Please find page 40 of the 2013 LabCorp annual report below. You can navigate through the pages in the report by either clicking on the pages listed below, or by using the keyword search tool below to find specific information within the annual report.-
 1
1 -
2
-
3
-
4
-
5
-
6
-
7
-
8
-
9
-
10
-
11
-
12
-
13
-
14
-
15
-
16
-
17
-
18
-
19
-
20
-
21
-
22
-
23
-
24
-
25
-
26
-
27
-
28
-
29
-
 30
30 -
 31
31 -
 32
32 -
 33
33 -
 34
34 -
 35
35 -
 36
36 -
 37
37 -
 38
38 -
 39
39 -
 40
40 -
 41
41 -
 42
42 -
 43
43 -
 44
44 -
 45
45 -
 46
46 -
 47
47 -
 48
48 -
 49
49 -
 50
50 -
51
-
52
-
53
-
54
-
55
-
56
-
57
-
58
 |
 |

36
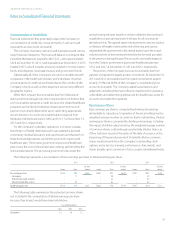
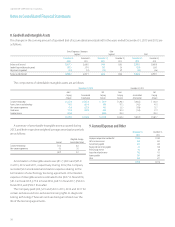
8. Goodwill and Intangible Assets
The changes in the carrying amount of goodwill (net of accumulated amortization) for the years ended December 31, 2013 and 2012 are
as follows:
Clinical Diagnostics Laboratory Other
Segment Segment Total
December 31, December 31, December 31, December 31, December 31, December 31,
2013 2012 2013 2012 2013 2012
Balance as of January 1 $ 2,857.1 $ 2,643.5 $ 44.6 $ 38.3 $ 2,901.7 $ 2,681.8
Goodwill acquired during the period 107.5 219.1 19.5 5.4 127.0 224.5
Adjustments to goodwill (4.4) (5.5) (1.5) 0.9 (5.9) (4.6)
Balance at end of period $ 2,960.2 $ 2,857.1 $ 62.6 $ 44.6 $ 3,022.8 $ 2,901.7
The components of identifiable intangible assets are as follows:
December 31, 2013 December 31, 2012
Gross Net Gross Net
Carrying Accumulated Carrying Carrying Accumulated Carrying
Amount Amortization Amount Amount Amortization Amount
Customer relationships $ 1,327.0 $ (545.1) $ 781.9 $ 1,296.1 $ (483.3) $ 812.8
Patents, licenses and technology 116.2 (85.4) 30.8 117.2 (76.2) 41.0
Non-compete agreements 41.6 (25.3) 16.3 32.3 (19.6) 12.7
Trade names 131.4 (83.0) 48.4 131.3 (73.4) 57.9
Canadian licenses 694.6 – 694.6 743.3 – 743.3
$ 2,310.8 $ (738.8) $ 1,572.0 $ 2,320.2 $ (652.5) $ 1,667.7
LABORATORY CORPORATION OF AMERICA
Notes to Consolidated Financial Statements
A summary of amortizable intangible assets acquired during
2013, and their respective weighted average amortization periods
are as follows:
Weighted-Average
Amount Amortization Period
Customer relationships $ 31.6 16.2
Non-compete agreements 9.3 5.0
$ 40.9 13.7
Amortization of intangible assets was $81.7, $86.3 and $85.8
in 2013, 2012 and 2011, respectively. During 2012, the Company
recorded $6.2 accelerated amortization expense relating to the
termination of a technology licensing agreement. Amortization
expense of intangible assets is estimated to be $84.7 in fiscal 2014,
$81.3 in fiscal 2015, $75.9 in fiscal 2016, $68.7 in fiscal 2017, $58.4 in
fiscal 2018, and $504.7 thereafter.
The Company paid $0.0, $2.5 and $0.0 in 2013, 2012 and 2011 for
certain exclusive and non-exclusive licensing rights to diagnostic
testing technology. These amounts are being amortized over the
life of the licensing agreements.
9. Accrued Expenses and Other
December 31, December 31,
2013 2012
Employee compensation and benefits $ 166.0 $ 158.0
Self-insurance reserves 33.3 34.2
Accrued taxes payable 24.2 24.0
Royalty and license fees payable 8.1 13.8
Restructuring reserves 9.3 8.4
Acquisition related reserves 14.2 11.5
Interest payable 19.7 24.0
Other 35.2 37.7
$ 310.0 $ 311.6