LabCorp 2013 Annual Report Download - page 55
Download and view the complete annual report
Please find page 55 of the 2013 LabCorp annual report below. You can navigate through the pages in the report by either clicking on the pages listed below, or by using the keyword search tool below to find specific information within the annual report.-
 1
1 -
2
-
3
-
4
-
5
-
6
-
7
-
8
-
9
-
10
-
11
-
12
-
13
-
14
-
15
-
16
-
17
-
18
-
19
-
20
-
21
-
22
-
23
-
24
-
25
-
26
-
27
-
28
-
29
-
30
-
31
-
32
-
33
-
34
-
35
-
36
-
37
-
38
-
39
-
40
-
41
-
42
-
43
-
44
-
 45
45 -
 46
46 -
 47
47 -
 48
48 -
 49
49 -
 50
50 -
 51
51 -
 52
52 -
 53
53 -
 54
54 -
 55
55 -
 56
56 -
 57
57 -
 58
58
 |
 |

51
19. Supplemental Cash Flow Information
Years Ended December 31,
2013 2012 2011
Supplemental schedule of cash flow information:
Cash paid during period for:
Interest $ 97.2 $ 77.5 $ 99.6
Income taxes, net of refunds 301.5 306.2 309.4
Disclosure of non-cash financing and investing activities:
Surrender of restricted stock awards
and performance shares 7.1 10.9 6.0
Conversion of zero-coupon convertible debt 10.3 3.8 36.2
Assets acquired under capital leases 13.1 – –
Accrued property, plant and equipment 9.1 1.2 –
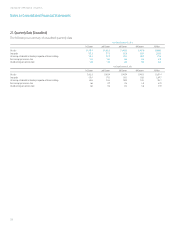
20. Business Segment Information
The following table is a summary of segment information for the
years ended December 31, 2013, 2012, and 2011. Segment asset
information is not presented because it is not used by the chief
operating decision maker at the operating segment level. Operating
earnings (loss) of each segment represents net revenues less directly
identifiable expenses to arrive at operating income for the segment.
General management and administrative corporate expenses are
included in general corporate expenses below.
Laboratory tests and procedures are used generally by hospitals,
physicians and other health care providers and commercial clients
to assist in the diagnosis, evaluation, detection, therapy selection,
monitoring and treatment of diseases and other medical conditions
through the examination of substances in the blood, tissues and
other specimens. Clinical diagnostics laboratory segment includes
financial information related to the broad range of testing services
that are reported primarily through the U.S. business operations.
The other reportable segment includes the Company’s non-U.S.
clinical diagnostic laboratory operations in Ontario, Canada, which
are reviewed separately by corporate management for the purposes
of allocation of resources.
2013 2012 2011
Net revenues:
Clinical laboratory diagnostics $ 5,465.2 $ 5,336.4 $ 5,232.9
Other 343.1 335.0 309.4
Total net revenues $ 5,808.3 $ 5,671.4 $ 5,542.3
Operating earnings (loss):
Clinical laboratory diagnostics $ 1,440.1 $ 1,435.4 $ 1,396.2
Other 93.9 96.8 98.5
General corporate expenses (543.1) (508.7) (546.3)
Total operating income 990.9 1,023.5 948.4
Non-operating expenses, net (75.3) (79.3) (82.3)
Earnings before income taxes 915.6 944.2 866.1
Provision for income taxes 340.2 359.4 333.0
Net earnings 575.4 584.8 533.1
Less: Net income attributable to noncontrolling interests (1.6) (1.7) (13.4)
Net income attributable to Laboratory Corporation
of America Holdings $ 573.8 $ 583.1 $ 519.7
2013 2012 2011
Depreciation and amortization:
Clinical laboratory diagnostics $ 171.2 $ 169.1 $ 177.3
Other 9.2 8.1 6.7
General corporate 42.1 40.3 39.6
Total depreciation and amortization $ 222.5 $ 217.5 $ 223.6
LABORATORY CORPORATION OF AMERICA
Notes to Consolidated Financial Statements