LabCorp 2013 Annual Report Download - page 8
Download and view the complete annual report
Please find page 8 of the 2013 LabCorp annual report below. You can navigate through the pages in the report by either clicking on the pages listed below, or by using the keyword search tool below to find specific information within the annual report.-
 1
1 -
 2
2 -
 3
3 -
 4
4 -
 5
5 -
 6
6 -
 7
7 -
 8
8 -
 9
9 -
 10
10 -
 11
11 -
 12
12 -
 13
13 -
 14
14 -
 15
15 -
 16
16 -
 17
17 -
 18
18 -
 19
19 -
20
-
21
-
22
-
23
-
24
-
25
-
26
-
27
-
28
-
29
-
30
-
31
-
32
-
33
-
34
-
35
-
36
-
37
-
38
-
39
-
40
-
41
-
42
-
43
-
44
-
45
-
46
-
47
-
48
-
49
-
50
-
51
-
52
-
53
-
54
-
55
-
56
-
57
-
58
 |
 |

4
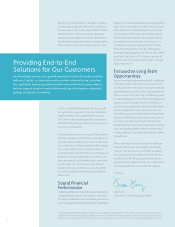
Providing End-to-End
Solutions for Our Customers
Our knowledge services now go well beyond the testing of samples and the
delivery of results, as we provide end-to-end lab solutions for our customers.
Our capabilities include population health management tools, data analytics,
decision support programs, personalized medicine and companion diagnostic
testing, and genetic counseling.
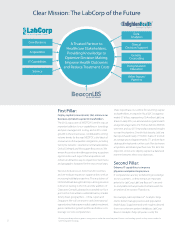
laboratory provider based on the payer’s policies
and laboratory network. BeaconLBS is designed
to assist payers with a rules engine that interfaces
with policies for seamless ordering, utilization,
adjudication and payment. And it is designed to
benefi t patients by assisting them in obtaining the
highest quality at the lowest out-of-pocket cost.
In 2013, UnitedHealthcare selected BeaconLBS
to implement its product in Florida. We expect
implementation of this agreement to occur in
2014, and we are excited about the opportunity
for BeaconLBS to demonstrate its value to payers,
physicians and patients.
Our knowledge services now go well beyond the
testing of samples and the delivery of results, as we
provide end-to-end lab solutions for our customers.
Our capabilities include population health manage-
ment tools, data analytics, decision-support
programs, personalized medicine and companion
diagnostic testing, and genetic counseling. Over
time, we intend to add mobile health, connected
devices and care in the home to our range of
product off erings. All of these tools will confi rm
our critical position in the emerging healthcare
value chain.
Sound Financial
Performance
Challenges often accompany disruptive marketplace
change, and this dynamic was evident in fi scal 2013.
The major headwinds were unfavorable government
payment reductions and reimbursement challenges
related to our molecular pathology testing; together
these factors generated a headwind that we esti-
mate reduced our adjusted operating earnings
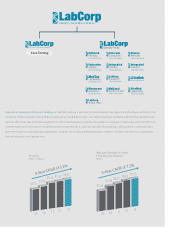
by more than $100 million. Given that, LabCorp
delivered another strong fi nancial performance,
generating revenue growth of 2.4 percent, to
$5.8 billion, and Adjusted Earnings Per Share
Excluding Amortization of $6.95. LabCorp also
generated solid Operating Cash Flow of $819 million
and Free Cash Flow of $617 million, almost all
of which we returned to shareholders through
share repurchase2.
Focused on Long-Term
Opportunities
We are committed to generating durable, sustainable,
profi table growth. We are in this business for the
long haul and have confi dence that our knowledge
partnership mission and our fi ve-pillar strategy will
lead to success. Fiscal 2013 was a challenging year
in many respects, and some of those challenges are
likely to remain through fi scal 2014. With this in
mind, we are committed to gaining market share,
improving growth in our esoteric businesses,
diversifying our revenue base and driving greater
operational effi ciency and cost reductions across
our businesses. We are privileged to have over
34,000 employees who care for patients every day,
and I am deeply grateful to them for their extra-
ordinary eff orts. It is an honor beyond description
to lead them.
The continuing, inevitable change in healthcare
requires LabCorp to continually and inevitably
change. That said, we are committed to leading
our industry and the healthcare system into the
world that will be. We are privileged to have the
opportunity and grateful to you, our shareholders
and stakeholders, for your continued support.
Sincerely,
Dave King
Chairman and Chief Executive Offi cer
2 Adjusted Earnings Per Share Excluding Amortization is calculated by excluding the effects of the impact of restructuring and other special
charges and amortization expense from GAAP diluted earnings per share. Free cash flow represents cash flows from operations less capital
expenditures. For a reconciliation of non-GAAP financial measures, please refer to slides 7-9 of the Company’s 8-K filed on February 7, 2014.