LabCorp 2013 Annual Report Download - page 13
Download and view the complete annual report
Please find page 13 of the 2013 LabCorp annual report below. You can navigate through the pages in the report by either clicking on the pages listed below, or by using the keyword search tool below to find specific information within the annual report.-
 1
1 -
2
-
 3
3 -
 4
4 -
 5
5 -
 6
6 -
 7
7 -
 8
8 -
 9
9 -
 10
10 -
 11
11 -
 12
12 -
 13
13 -
 14
14 -
 15
15 -
 16
16 -
 17
17 -
 18
18 -
 19
19 -
 20
20 -
 21
21 -
 22
22 -
 23
23 -
24
-
25
-
26
-
27
-
28
-
29
-
30
-
31
-
32
-
33
-
34
-
35
-
36
-
37
-
38
-
39
-
40
-
41
-
42
-
43
-
44
-
45
-
46
-
47
-
48
-
49
-
50
-
51
-
52
-
53
-
54
-
55
-
56
-
57
-
58
 |
 |

9
LABORATORY CORPORATION OF AMERICA
Management’s Discussion and Analysis
of Financial Condition and Results of Operations (in millions)
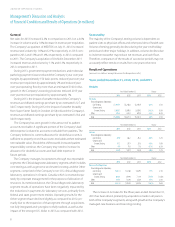
During 2013, the impact of weather, reduced the Company’s
revenues by an estimated $12.7, of which $5.3 occurred in the fourth
quarter. The 2013 decline in revenue per requisition in genomic and
esoteric testing is a result of a change in mix of genetic and histology
testing. Histology revenue per requisition was also impacted by pay-
ment reductions on the Medicare physician fee schedule. Further,
revenue per requisition also decreased due to delays in payments and
denials of coverage for existing tests by some payers after implemen-
tation of new molecular pathology codes at the beginning of the
year and the implementation of sequestration on April 1, 2013.
During the fourth quarter of 2012, the impact of weather
reduced revenue by an estimated $16.0. The increase in net sales
for the year ended December 31, 2012 as compared with 2011 was
driven primarily by the MEDTOX and Orchid acquisitions and by
contributions from the milder winter weather experienced in the
first quarter of 2012, along with positive volume growth in genomic
and esoteric testing and the Other segment, offset by volume
losses sustained in the fourth quarter of 2012 due to Super Storm
Sandy. Genomic and esoteric testing volume as a percentage of
total volume was 23.7% in both 2012 and 2011. Volume growth for
genomic and esoteric testing was primarily due to the incremental
volume from Orchid as well as growth in the NuSwab® series of
women’s health tests, offset by declines in histology and surgical
pathology volumes. The decline in price in genomic and esoteric
testing is a result of a lower mix of reproductive and histology testing.
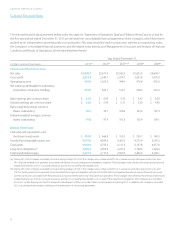
Net sales of the Other segment were $343.1 for 2013 compared
to $335.0 in 2012, an increase of $8.1, or 2.4%. Net sales of the Other
segment were negatively impacted by a stronger U.S. dollar in 2013
as compared with 2012 and 2011. In Canadian dollars, net sales of
the Other segment for the twelve months ended December 31, 2013,
2012 and 2011 were CN$353.2, CN$334.7 and CN$306.0, respectively.
Cost of Sales
Years Ended December 31, Change
2013 2012 2011 2013 2012
Cost of sales $ 3,585.1 $ 3,421.7 $ 3,267.6 4.8% 4.7%
Cost of sales
as a % of sales 61.7% 60.3% 59.0%
Cost of sales (primarily laboratory and distribution costs)
increased 4.8% in 2013 as compared with 2012 primarily due to
increased test volumes and test mix changes. The increase in cost
of sales as a percentage of net sales in 2013 as compared to 2012
is primarily due to lower revenues resulting from the Medicare fee
reductions, the impact of delays and denials of coverage of molecular
pathology codes and sequestration in 2013, as mentioned above.
The increase in cost of sales as a percentage of net sales in 2012 as
compared to 2011 was primarily due to the impact of weather,
lower margins on acquired operations that have not yet been fully
integrated as well as slower volume growth.
Labor and testing supplies for the year ended December 31,
2013, comprise over 77.4% of the Company’s cost of sales. Cost of
sales has increased over the three year period ended December 31,
2013 primarily due to overall growth in the Company’s volume, the
impact of acquisitions, increases in labor, and the continued shift in
test mix to genomic and esoteric testing which contributed to the
higher cost of testing supplies.
Selling, General and Administrative Expenses
Years Ended December 31, Change
2013 2012 2011 2013 2012
Selling, general and
administrative expenses $ 1,128.8 $ 1,114.6 $ 1,159.6 1.3% (3.9)%
SG&A as a % of sales 19.4% 19.7% 20.9%
Selling, general and administrative expenses as a percentage of
net sales decreased to 19.4% in 2013 compared to 19.7% in 2012.
The decrease in selling, general and administrative expenses as a
percentage of net sales is primarily due to $9.9 in fees related to the
MEDTOX acquisition recorded in 2012 and to efficiencies from
acquired operations that are being integrated into the Company’s
operating cost structure. Additionally, bad debt expense increased to
4.4% of net sales in 2013 as compared to 4.3% of net sales in 2012.
Selling, general and administrative expenses as a percentage of
net sales decreased to 19.7% in 2012 compared to 20.9% in 2011.
The decrease in selling, general and administrative expenses as a
percentage of net sales was partially due to expense management
and to efficiencies from acquired operations that were integrated
into the Company’s cost structure. Additionally, bad debt expense
decreased to 4.3% of net sales in 2012 as compared with 4.6% in
2011 primarily due to improved collection trends resulting from
process improvement programs within the Company’s billing
department and field operations. These decreases in selling,
general and administrative expenses were partially offset by $9.9
in transaction fees related to the MEDTOX acquisition, mentioned
above. During 2011, the Company recorded the settlement of the
Hunter Labs litigation in California for $34.5 ($49.5 settlement less
previously recorded reserves of $15.0) in selling, general and
administrative expenses.