LabCorp 2013 Annual Report Download - page 15
Download and view the complete annual report
Please find page 15 of the 2013 LabCorp annual report below. You can navigate through the pages in the report by either clicking on the pages listed below, or by using the keyword search tool below to find specific information within the annual report.-
 1
1 -
2
-
3
-
4
-
 5
5 -
 6
6 -
 7
7 -
 8
8 -
 9
9 -
 10
10 -
 11
11 -
 12
12 -
 13
13 -
 14
14 -
 15
15 -
 16
16 -
 17
17 -
 18
18 -
 19
19 -
 20
20 -
 21
21 -
 22
22 -
 23
23 -
 24
24 -
 25
25 -
26
-
27
-
28
-
29
-
30
-
31
-
32
-
33
-
34
-
35
-
36
-
37
-
38
-
39
-
40
-
41
-
42
-
43
-
44
-
45
-
46
-
47
-
48
-
49
-
50
-
51
-
52
-
53
-
54
-
55
-
56
-
57
-
58
 |
 |

11
LABORATORY CORPORATION OF AMERICA
Management’s Discussion and Analysis
of Financial Condition and Results of Operations (in millions)
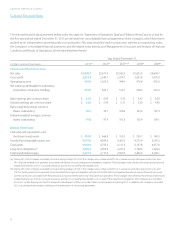
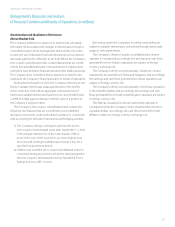
Equity Method Income
Years Ended December 31, Change
2013 2012 2011 2013 2012
Equity method income $ 16.9 $ 21.4 $ 9.5 (21.0)% 125.3%
Equity method income represents the Company’s ownership
share in joint venture partnerships along with equity investments in
other companies in the healthcare industry. The decrease in income
in 2013 compared to 2012 is primarily the result of a $2.9 increase
recorded in 2012 due to the liquidation of one of its joint ventures
and a decline in profitability of one of the Company’s joint venture
partnerships due to a challenging business climate in its market.
The increase in income in 2012 compared with 2011 is primarily
due to the Company’s share of losses during 2011 in the Cincinnati,
Ohio joint venture (liquidation initiated in the second half of 2011)
and the Canada, China, Singapore and Western Europe equity
method investments (acquired by the Company in the second half
of 2011) and the $2.9 increase in equity method income recorded in
2012, in conjunction with the liquidation of one of its joint ventures.
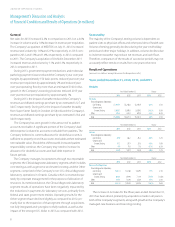
Income Tax Expense
Years Ended December 31,
2013 2012 2011
Income tax expense $ 340.2 $ 359.4 $ 333.0
Income tax expense as a % of income before tax 37.2% 38.1% 38.4%
The effective rate for 2013 was favorably impacted by the release
of a capital loss valuation allowance and recording two years of
the R&D tax credit. The American Taxpayer Relief Act of 2012 was
enacted in early 2013 and reinstated the R&D tax credit for 2012
and extended the credit for calendar year 2013.
The effective tax rate for 2012 was favorably impacted by a
decrease in the reserve for unrecognized income tax benefits com-
pared to 2011, partially offset by an increase in tax on the additional
investment in the Company’s Canadian subsidiary. The effective tax
rate for 2011 was negatively impacted by an increase in the reserve
for unrecognized income tax benefits, the divestiture of certain
Orchid paternity contracts, and foreign losses not tax effected.
Liquidity, Capital Resources and Financial Position
The Company’s strong cash-generating capability and financial
condition typically have provided ready access to capital markets.
The Company’s principal source of liquidity is operating cash flow,
supplemented by proceeds from debt offerings. This cash-generating
capability is one of the Company’s fundamental strengths and pro-
vides substantial financial flexibility in meeting operating, investing
and financing needs. The Company’s senior unsecured Revolving
Credit Facility is further discussed in “Note 11 to Consolidated
Financial Statements.”
On November 1, 2013, the Company issued $700.0 in new senior
notes pursuant to the Company’s effective shelf registration on
Form S-3. The senior notes consisted of $400.0 aggregate principal
amount of 2.50% Senior Notes due 2018 and $300.0 aggregate
principal amount of 4.00% Senior Notes due 2023. The net proceeds
were first used to repay all of the outstanding borrowings under
the Company’s Revolving Credit Facility and the remainder was used
for general corporate purposes.
During the third quarter of 2013, the Company entered into
fixed-to-variable interest rate swap agreements for the 4.625%
senior notes due 2020 with an aggregate notional amount of
$600.0 and variable interest rates based on one-month LIBOR plus
2.298% to hedge against changes in the fair value of a portion of the
Company’s long term debt. These derivative financial instruments
are accounted for as fair value hedges of the senior notes due 2020.
These interest rate swaps are included in other long term assets
and added to the value of the senior notes, with an aggregate fair
value of $0.0 at December 31, 2013. As the specific terms and
notional amounts of the derivative financial instruments match
those of the fixed-rate debt being hedged, the derivative instruments
are assumed to be perfectly effective hedges and accordingly, there
is no impact to the Company’s Consolidated Statements of Operations.
There were no derivative instruments designated as accounting
hedges in 2012.
On August 23, 2012, the Company issued $1,000.0 in new senior
notes pursuant to the Company’s effective shelf registration statement
on Form S-3. The new senior notes consisted of $500.0 aggregate
principal amount of 2.20% Senior Notes due 2017 and $500.0
aggregate principal amount of 3.75% Senior Notes due 2022. The
net proceeds were used to repay $625.0 of the outstanding borrow-
ings under the Company’s Revolving Credit Facility. The remaining
proceeds were available for other general corporate purposes.
On July 31, 2012, the Company completed its acquisition of
MEDTOX for $236.4 in cash, excluding transaction fees. The acquisition
was financed through borrowings from the Company’s Revolving
Credit Facility and cash on hand.