Lowe's 2001 Annual Report Download - page 23
Download and view the complete annual report
Please find page 23 of the 2001 Lowe's annual report below. You can navigate through the pages in the report by either clicking on the pages listed below, or by using the keyword search tool below to find specific information within the annual report.-
 1
1 -
2
-
3
-
4
-
5
-
6
-
7
-
8
-
9
-
10
-
11
-
12
-
 13
13 -
 14
14 -
 15
15 -
 16
16 -
 17
17 -
 18
18 -
 19
19 -
 20
20 -
 21
21 -
 22
22 -
 23
23 -
 24
24 -
 25
25 -
 26
26 -
 27
27 -
 28
28 -
 29
29 -
 30
30 -
 31
31 -
 32
32 -
 33
33 -
34
-
35
-
36
-
37
-
38
-
39
-
40
-
41
-
42
-
43
-
44
-
45
-
46
-
47
-
48
 |
 |

Lo we’s Co mpanies, Inc.
21
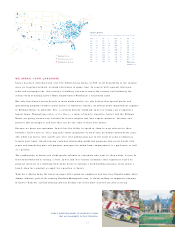
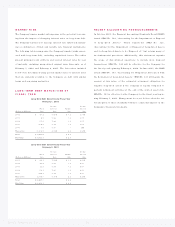
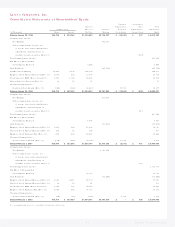
2001 2000 1999
Sales ( in millio ns) $22,111
$18,779 $15,906
Sales Increases 18%
18% 19%
Co mparable Store Sales Increases 2%
1% 6%
At end of year:
Sto res 744
650 576
Sales Flo o r Square Feet ( in millio ns)
80.7 67.8 57.0
Average Sto re Size Square Feet ( in tho usands)
108 104 99
Gro ss margin in 2001 was 28.8% of sales co mpared to 28.2% in
2000. Bo th o f these years showed impro vement o ver the 27.5%
rate achieved in 1999. Margin impro vements have co ntinued dur-
ing 2001, primarily resulting fro m co ntinued prog ress in line
reviews, better buying and pro duct mix improvements.
Selling, general and administrative expenses ( SG&A) were $3.9
billio n o r 17.7% o f sales in 2001. SG&A in the two previo us years
were $3.3 and $2.8 billio n o r 17.8% and 17.4% o f sales, respec-
tively. During 2001, SG&A increased 17% co mpared to the 18%
increase in sales. In 2000 SG&A increased 21% c o mpared to the
18% sales increase. The leverage in SG&A during 2001 is primarily
attributable to expense co ntrols invo lving payro ll and advertising
co sts. The increase in SG&A during 2000 was primarily attributable
to an increase in sto re salaries co mbined with lo wer than expec t-
ed sales levels.
Sto re o pening c o sts, which were expensed as incurred, were
$139.9 millio n fo r 2001 co mpared to $131.8 and $98.4 millio n in
2000 and 1999, respectively. These co sts are asso ciated with the
o pening o f 115 sto res in 2001 ( 101 new and 14 relo cated) . This
co mpares to 100 sto res in 2000 ( 80 new and 20 relo cated) and 91
sto res in 1999 ( 60 new and 31 relo cated) . As a percentage of sales,
sto re o pening co sts were 0.6% fo r 2001 co mpared to 0.7% and
0.6% in 2000 and 1999, respectively. Sto re o pening co sts averaged
appro ximately $1.2 millio n, $1.1 millio n and $1.0 millio n per sto re
in 2001, 2000 and 1999, respectively.
Deprec iatio n, reflecting co ntinued fixed asset expansio n,
increased 26% to $516.8 million in 2001, co mpared to increases
of 21% and 17% in 2000 and 1999, respectively. Depreciatio n as a
percentage o f sales was 2.4% fo r 2001, a slight increase fro m 2.2%
in 2000 and 2.1% in 1999. Approximately 25% of new sto res
o pened in the last three years have been leased, of which appro x-
imately 9% were under capital leases. Pro perty less accumulated
depreciatio n inc reased to $8.7 billion at February 1, 2002 co m-
pared to $7.0 billio n at February 2, 2001. The increase in pro perty
resulted primarily fro m the Co mpany’s sto re expansio n pro g ram,
including land, building, sto re equipment, fixtures and displays.
Net interest c o sts as a percent o f sales were 0.8% fo r 2001,
0.7% fo r 2000 and 0.5% fo r 1999. Net interest co sts to taled
$173.5 millio n in 2001, $120.8 million in 2000, and $84.9 millio n
in 1999. Interest co sts have increased due to an increase in debt
levels. Interest co sts relating to capital leases were $40.4, $42. 0
and $42.6 millio n fo r 2001, 2000 and 1999, respectively. See the
discussio n of liquidity and capital resources belo w.
The Co mpany’s effective inco me tax rates were 37.0% , 36.8%
and 36.7% in 2001, 2000, and 1999, respectively. The higher rates
in 2001 and 2000 were primarily related to expansio n into states
with higher state inco me tax rates.
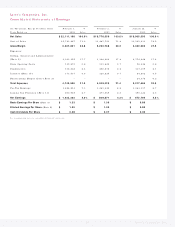
LI QUI DI TY AND CAPI TAL RESOURCES
The fo llo wing tables summarize the Co mpany’s significant co ntrac-
tual o bligatio ns and co mmercial co mmitments.
Payments Due by Perio d
Co ntrac tual ––– ––– – ––– – ––– – ––– ––– – ––– – ––– –––– ––– – ––– – ––– –––– ––– – ––– – ––– –––– ––– – ––– – ––– –––– ––– – ––– – ––– ––– – ––– – ––– – ––– ––– – ––– – ––– – ––– ––– – ––– – ––– – ––– –––– ––– – ––– – –
Obligatio ns Less than 1- 3 4- 5 After 5
( In Tho usands) To tal 1 ye ar ye ars ye ars ye ars
Sho rt- Term Debt $ 100,000 $100,000 $ –$ –$ –
Lo ng-Term De bt 3, 826,290 40,321 64,494 616,674 3,104,801
Capital Lease
Ob lig atio ns 85 1, 533 59, 345 118 ,020 11 4, 210 55 9, 958
Operating Leases 2, 991,367 187,705 379,349 358,586 2,065,727
To tal Co ntractual
Cash Obligatio ns $7,769,190 $387,371 $561,863 $1,089,470 $5,730,486
The primary sources of liquidity are cash flo ws fro m o perating
activities and certain financing activities, alo ng with vario us lines
of credit. Net cash pro vided by o perating activities was $1.6 billio n
fo r 2001. This co mpares to $1.1 billio n and $1.2 billio n in 2000 and
1999, respectively. The increase in cash pro vided by o perating
activities during 2001 resulted primarily fro m increased net earn-
ings, the funding of the Co mpany’s ESOP with the issuance o f co m-
mo n sto ck versus cash in the prio r year and improved invento ry
management. The decrease in cash pro vided by o perating activities
during 2000 was primarily the result of a year-o ver- year increase in
invento ries that exceeded the increase in acco unts payable, which
was partially o ffset by inc reased earnings and an increase in o ther
o perating liabilities. Wo rking capital at February 1, 2002 was $1.9
billio n c o mpared to $1.2 billion at February 2, 2001.
The primary co mpo nent of net cash used in investing activities
co ntinues to be new sto re facilities in c o nnectio n with the
Co mpany’s expansio n plan. Cash acquisitio ns o f fixed assets were