Lowe's 2001 Annual Report Download - page 40
Download and view the complete annual report
Please find page 40 of the 2001 Lowe's annual report below. You can navigate through the pages in the report by either clicking on the pages listed below, or by using the keyword search tool below to find specific information within the annual report.-
 1
1 -
2
-
3
-
4
-
5
-
6
-
7
-
8
-
9
-
10
-
11
-
12
-
13
-
14
-
15
-
16
-
17
-
18
-
19
-
20
-
21
-
22
-
23
-
24
-
25
-
26
-
27
-
28
-
29
-
 30
30 -
 31
31 -
 32
32 -
 33
33 -
 34
34 -
 35
35 -
 36
36 -
 37
37 -
 38
38 -
 39
39 -
 40
40 -
 41
41 -
 42
42 -
 43
43 -
 44
44 -
 45
45 -
 46
46 -
 47
47 -
 48
48
 |
 |

Lo we’s Co mpanies, Inc. 38
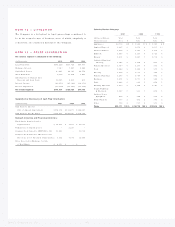
NOTE 14 > LITI GATI ON
The Co mpany is a defendant in legal pro ceedings co nsidered to
be in the no rmal co urse of business, no ne of which, singularly o r
co llectively, are c o nsidered material to the Co mpany.
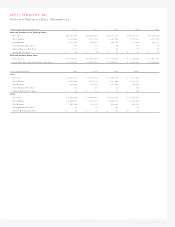
NOTE 15 > OTHER I NFORMATI ON
Net interest expense is composed of the following:
( In Tho usands) 2001 2000 1999
Lo ng-Term De bt $161,228 $117,024 $86,675
Mortgage Interest 7,980 7, 667 6,686
Capitalized Leases 40,441 42,041 42, 552
Sho rt- Term Debt 4,154 11,638 5,847
Amo rtizatio n o f Original Issue
Disco unt and Lo an Co sts 18,165 2,631 801
Interest Inco me ( 24,653) (25,049) ( 38,373)
Interest Capitalized (33,778) ( 35, 127) ( 19,336)
Net I nt erest Expense $173,537 $120,825 $84,852
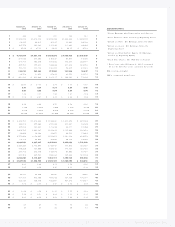
Supplemental Disclosures of Cash Flow I nformation:
( In Tho usands) 2001 2000 1999
Cash Paid fo r Interest
( Net o f Amo unt Capitalized) $ 178,354 $ 132,457 $ 128,265
Cash Paid fo r Inco me Taxes $ 532,235 $ 428,385 $ 408,366
Noncash I nvesting and Financing Activities:
Fixed Assets Acquired under
Capital Leases $ 12,677 $ 1,259 $ 27,573
Terminatio n of Capital Leases –2,223 –
Co mmo n Sto c k Issued to ESOP ( No te 12) 63,449 –59,512
Co mmo n Sto c k Issued to Executives and
Directo rs, ne t o f Unearned Compensation 1, 912 7,734 12,488
No te s Re ceived in Exchange fo r Sale
of Real Estate $ 4, 150 $ –$–
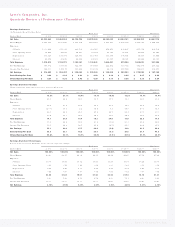
Sales by Product Category:
2001 2000 1999
––– ––– – ––– – ––– – ––– ––– – ––– – ––– –––– ––– – – ––– – ––– – ––– ––– – ––– – ––– – ––– ––– – ––– – –– –– – ––– ––– – ––– – ––– –––– ––– – ––– – ––– ––––
( Dollars in Millio ns) Total To tal To tal
Pro duc t Catego ry Sales % Sales % Sale s %
Applianc es $2,504 11 % $ 1,922 10 % $ 1,341 8 %
Lumb er/ Plywo o d 1 ,9 97 9 1, 67 6 9 1,6 07 1 0
Outdo o r Fashio n 1,474 7 1,323 7 1,102 7
Millwo rk 1 ,443 6 1, 19 7 6 1,0 21 6
Nurse ry 1,401 6 1,247 7 1,006 6
Cabinets/ Furniture/
Shelving 1, 383 6 1,138 6 897 6
Fashio n Elec trical 1,340 6 1,135 6 959 6
To o ls 1, 282 6 1 ,1 24 6 951 6
Flo o ring 1, 27 8 6 1 ,00 9 5 7 26 5
Fashio n Plumbing 1,263 6 1,046 6 862 5
Hardware 1, 251 6 1,070 6 946 6
Paint 1, 244 6 996 5 858 5
Building Materials 1,239 6 1, 148 6 1,080 7
Ro ugh Plumbing
& Electrical 1,147 5 993 5 854 5
Outdo o r Po we r
Equipment 818 4 768 4 676 4
Walls/ Windo ws 5 33 2 452 2 3 61 2
Other 514 2 535 4 659 6
Totals $22,111 100 % $18,779 100 % $15,906 100 %