Lowe's 2001 Annual Report Download - page 27
Download and view the complete annual report
Please find page 27 of the 2001 Lowe's annual report below. You can navigate through the pages in the report by either clicking on the pages listed below, or by using the keyword search tool below to find specific information within the annual report.-
 1
1 -
2
-
3
-
4
-
5
-
6
-
7
-
8
-
9
-
10
-
11
-
12
-
13
-
14
-
15
-
16
-
 17
17 -
 18
18 -
 19
19 -
 20
20 -
 21
21 -
 22
22 -
 23
23 -
 24
24 -
 25
25 -
 26
26 -
 27
27 -
 28
28 -
 29
29 -
 30
30 -
 31
31 -
 32
32 -
 33
33 -
 34
34 -
 35
35 -
 36
36 -
 37
37 -
38
-
39
-
40
-
41
-
42
-
43
-
44
-
45
-
46
-
47
-
48
 |
 |

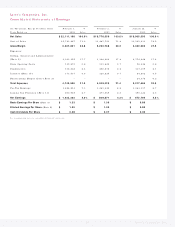
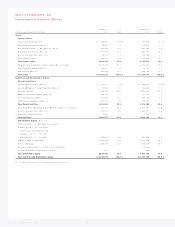
Lo we’s Co mpanies, Inc.
25
( In Tho usands, Except Per Share Data) February 1, % February 2, % January 28, %
Years Ended o n 2002 Sales 2001 Sales 2000 Sales
Net Sales $ 22,111,108 100.0% $ 18,778,559 100.0 % $ 15,905,595 100.0 %
Co st of Sales 15,743,267 71.2 13,487,791 71.8 11,525,013 72.5
Gross Margin 6,367,841 28.8 5,290,768 28.2 4,380,582 27.5
Expenses:
Selling, General and Administrative
( No te 5) 3,913,355 17.7 3,348,060 17.8 2,772,428 17.4
Sto re Opening Co sts 139,870 0.6 131,825 0.7 98,448 0.6
Depre ciatio n 516,828 2.4 408,618 2.2 337,359 2.1
Interest ( No te 15) 173,537 0.8 120,825 0.7 84,852 0.5
No nrecurring Merger Co sts ( No te 2) –– – – 24,378 0.2
Total Expenses 4,743,590 21.5 4,009,328 21.4 3,317,465 20.8
Pre-Tax Earnings 1,624,251 7.3 1,281,440 6.8 1,063,117 6.7
Inco me Tax Pro visio n ( No te 13) 600,989 2.7 471,569 2.5 390,322 2.5
Net Earnings $ 1,023,262 4.6% $ 809,871 4.3 % $ 672,795 4.2 %
Basic Earnings Per Share ( No te 9) $ 1.33 $ 1.06 $ 0.88
Diluted Earnings Per Share ( No te 9) $ 1.30 $ 1.05 $ 0.88
Cash Dividends Per Share $ 0.08 $ 0.07 $ 0.06
Se e acco mpanying note s to co nso lidate d financial stat e me nts.
Lo we’s Co mpanies, Inc.
Co nso lidated Statements of Earnings