Lowe's 2001 Annual Report Download - page 5
Download and view the complete annual report
Please find page 5 of the 2001 Lowe's annual report below. You can navigate through the pages in the report by either clicking on the pages listed below, or by using the keyword search tool below to find specific information within the annual report.-
 1
1 -
 2
2 -
 3
3 -
 4
4 -
 5
5 -
 6
6 -
 7
7 -
 8
8 -
 9
9 -
 10
10 -
 11
11 -
 12
12 -
 13
13 -
 14
14 -
 15
15 -
 16
16 -
17
-
18
-
19
-
20
-
21
-
22
-
23
-
24
-
25
-
26
-
27
-
28
-
29
-
30
-
31
-
32
-
33
-
34
-
35
-
36
-
37
-
38
-
39
-
40
-
41
-
42
-
43
-
44
-
45
-
46
-
47
-
48
 |
 |

3
By any measure, 2001 was a challenging year. A year o f change, intro spectio n and progress.
In an eco no mic and co mpetitive enviro nment where many co mpanies faltered and o thers failed, Lo we’s
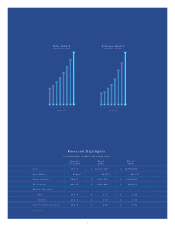
prevailed and pro spered. The co mpany o pened 115 sto res, bringing o ur to tal number to 744; achieved sales
of $22.1 billio n, a 17.7% increase o ver last year; and inc reased net earnings by 26.3% , to o ver o ne billio n
do llars, o r $1.30 per share.
Impo rtantly, this perfo rmance was balanced. The co mpany’s sales increases were a result of a strong
perfo rmance from o ur new sto res, and co mparable sto res ( tho se o pen 13 mo nths o r lo nger) gro wing at a
respectable 2.4% in 2001 …despite a so ft eco no my and waning co nsumer co nfidence. This balanced
perfo rmance was also a pro duct o f: increases in bo th custo mer traffic and average ticket, a better sales
mix resulting in higher gro ss margins, tighter co st co ntro ls, and an unrelenting co mmitment to business
process impro vement.
Our perfo rmance, as repo rted o n o ur financial statements, reflects o nly the numerical successes we enjo y.
The real sto ry is what’s behind the numbers. Our average ticket increase of two percentage po ints ( the sixth
co nsecutive annual increase) reflec ts the effectiveness of o ur displays, signing and training pro g rams. Our
gro ss margin impro vement o f 63 basis po ints suggests o ur fo cus o n pro duct line design is wo rking. And o ur
transactio n co unt increase of o ver 15% illustrates o ur ability to attract and satisfy mo re c usto mers than
ever befo re with impro ved asso rtments, greater value, higher levels o f service and better o rganized, easier-
to - sho p sto res.
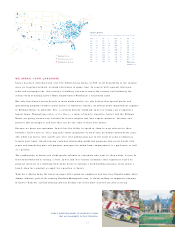
In the spring of 2001 we o pened o ur first sto re in the Bo sto n metro po litan area in Danvers, M.A. In the
fall, we o pened two sto res in the New Yo rk City area, in Medfo rd, N.Y., and No rth Bergen, N.J. The suc cess of
these sto res again validates o ur metro strategy. We remain c o mmitted to building mo re sto res in majo r
metro po litan markets, where o ur sto res typic ally perfo rm abo ve co mpany averages. In fact, approximately
65% of the 123 sto res we will o pen in 2002 are in metro lo catio ns.
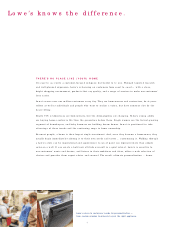
But Lo we’s is building mo re than sto res. We’re building a brand —the Lo we ’s brand. Great brands are like
go o d friends. We’ll go o ut o f o ur way fo r them because we like and trust them. Succ essful brands make bo th
an emo tio nal as well as ratio nal co nnectio n with co nsumers. And to the extent the brand is actually different
and better than a co mpeting brand, it achieves what all brands aspire to …lo yalty and lo ngevity.
Lo we ’s brand- building platfo rm is designed to answer the “Why Lo we’s?” questio n. Why sho uld custo mers
be expected to drive by o ne of Lo we’s co mpetito rs to buy the pro ducts they need o r want to maintain, repair
o r impro ve their ho mes?
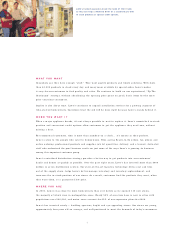
The answer to this questio n fo rms the fo undatio n o f Lo we’s merchandising and o peratio nal strategy. To day,
Lo we ’s o ffers o ur custo mers reputable, reliable and, where appro priate and po ssible, e xclusive natio nal branded
To o ur shareho lders:
Ro bert L. Tillman
Chairman of the Bo ard and
Chief Exec utive Officer