Lowe's 2001 Annual Report Download - page 30
Download and view the complete annual report
Please find page 30 of the 2001 Lowe's annual report below. You can navigate through the pages in the report by either clicking on the pages listed below, or by using the keyword search tool below to find specific information within the annual report.-
 1
1 -
2
-
3
-
4
-
5
-
6
-
7
-
8
-
9
-
10
-
11
-
12
-
13
-
14
-
15
-
16
-
17
-
18
-
19
-
 20
20 -
 21
21 -
 22
22 -
 23
23 -
 24
24 -
 25
25 -
 26
26 -
 27
27 -
 28
28 -
 29
29 -
 30
30 -
 31
31 -
 32
32 -
 33
33 -
 34
34 -
 35
35 -
 36
36 -
 37
37 -
 38
38 -
 39
39 -
 40
40 -
41
-
42
-
43
-
44
-
45
-
46
-
47
-
48
 |
 |

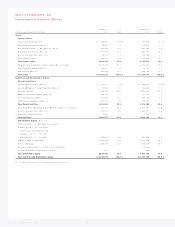
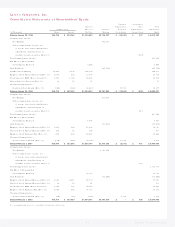
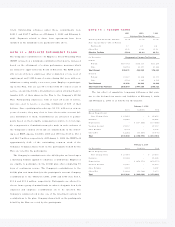
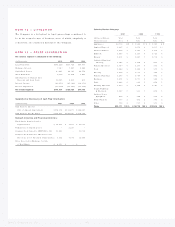
Lo we’s Co mpanies, Inc. 28
( In Tho usands) February 1, February 2, January 28,
Years Ended On 2002 2001 2000
Cash Flows From Operating Activities:
Net Earnings $ 1,023, 262 $ 809,871 $ 672,795
Adjustments to Reco nc ile Net Earnings to Net Cash
Pro vided By Operating Activities:
Depreciation and Amo rtizatio n 534,102 409,511 337,822
Deferred Inco me Taxes 41,658 23,284 13,439
Lo ss o n Dispo sitio n/ Writedo wn of Fixed and Other Assets 38,930 22,733 51,520
Tax Effect of Sto ck Optio ns Exercised 35,019 7, 465 9, 888
Changes in Operating Assets and Liabilitie s:
Acco unts Rece ivable — Net ( 4,593) ( 13, 084) ( 3,973)
Merchandise Invento ry (325,406) (473,009) ( 427,661)
Other Operating Asse ts ( 36,792) ( 59, 651) ( 50,324)
Acco unts Payable 406 158,419 335,408
Emplo yee Retirement Plans 113,823 ( 26,357) 76, 024
Other Operating Liabilitie s 192,640 270,527 182,223
Net Cash Provided by Operating Activities 1,613,049 1,129,709 1,197,161
Cash Flows from I nvesting Activities:
( Inc rease) Decrease in Investment Assets:
Sho rt- Term Investments — Net ( 29,958) 75,738 ( 50,998)
Purchases of Lo ng - Term Investments ( 1,042) ( 13, 951) ( 12,413)
Pro ceeds from Sale/ Maturity of Lo ng- Term Investments 2, 878 750 2,531
Increase in Other Lo ng - Term Assets ( 13,661) ( 51,675) ( 53,028)
Fixed Assets Acquired ( 2,199,108) ( 2,331,922) ( 1, 472,348)
Pro ceeds from the Sale o f Fixed and Other Lo ng - Term Assets 41,557 71,399 67,837
Net Cash Used in I nvesting Activities ( 2,199,334) ( 2,249,661) ( 1,518,419)
Cash Flows from Financing Activities:
Net ( Decrease) Increase in Sho rt- Term Bo rro wings ( 149,829) 157,354 (24,600)
Lo ng-Term De bt Bo rro wing s 1, 087,071 1,014,878 394,588
Re payment of Lo ng-Term Debt ( 63,762) ( 61,285) ( 108,309)
Pro ceeds from Sto ck Offering ––348,300
Pro ceeds from Emplo yee Sto c k Purchase Plan 37,937 14,889 –
Pro ceeds from Sto ck Optio ns Exercised 77,933 12,131 21,085
Cash Dividend Payments ( 59,884) ( 53,479) ( 47,558)
Net Cash Provided by Financing Activities 929,466 1,084,488 583,506
Net Inc rease ( De crease) in Cash and Cash Equivalents 343,181 ( 35,464) 262,248
Cash and Cash Equivalents, Beginning o f Ye ar 455,658 491,122 228,874
Cash and Cash Equivalents, End of Year $ 798,839 $ 455,658 $ 491,122
Se e acco mpanying note s to co nso lidate d financial stat e me nts.
Lo we’s Co mpanies, Inc.
Co nso lidated Statements of Cash Flo ws