Lowe's 2001 Annual Report Download - page 45
Download and view the complete annual report
Please find page 45 of the 2001 Lowe's annual report below. You can navigate through the pages in the report by either clicking on the pages listed below, or by using the keyword search tool below to find specific information within the annual report.-
 1
1 -
2
-
3
-
4
-
5
-
6
-
7
-
8
-
9
-
10
-
11
-
12
-
13
-
14
-
15
-
16
-
17
-
18
-
19
-
20
-
21
-
22
-
23
-
24
-
25
-
26
-
27
-
28
-
29
-
30
-
31
-
32
-
33
-
34
-
 35
35 -
 36
36 -
 37
37 -
 38
38 -
 39
39 -
 40
40 -
 41
41 -
 42
42 -
 43
43 -
 44
44 -
 45
45 -
 46
46 -
 47
47 -
 48
48
 |
 |

Lo we’s Co mpanies, Inc.
43
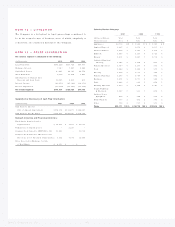
January 31, January 3 1, January 31, January 31, January 3 1,
1997 1996 1995 1994 1993
1429 389 355 324 310 1
233,729,529 26,806,111 20,852,368 15,694,889 10,828,722 2
358,585 48,405 40,637 31,243 22,569 3
4195,778 163,193 136,342 100,963 84,268 4
5$ 47.82 $ 47.13 $ 48.62 $ 48.15 $ 47.39 5
6 $ 9,361,204 $ 7,691,116 $ 6,629,276 $ 4,860,939 $ 3,993,699 6
7209,612 159,281 116,415 83,877 71,326 7
8753,099 582,134 493,432 332,296 228,750 8
9487,765 377,415 344,492 230,611 141,766 9
10 173,035 135,052 126,952 78,657 47,119 10
11 314,730 242,363 217,540 151,954 94,647 11
12 34,709 30,471 27,433 23,571 21,153 12
13 $ 280,021 $ 211,892 $ 190,107 $ 128,383 $ 73,494 13
14 $ 12.83 $ 10.76 $ 9. 57 $ 7.59 $ 6.60 14
15 0.43 0.34 0.31 0.24 0.16 15
16 0.05 0.05 0.04 0.04 0.04 16
17 0. 38 0.30 0. 27 0.20 0.12 17
18 $ 3.52 $ 2.60 $ 2. 31 $ 1.66 $ 1.38 18
19 2. 36 2.22 2.70 2.79 2.66 19
20 3.36% 3.15% 3.28% 3.13% 2.37% 20
21 7.93% 6.99% 8.87% 8.73% 6.29% 21
22 16.95% 15.12% 20.48% 18.21% 13.24% 22
23 $ 2,134,761 $ 1, 804,994 $ 1, 744,465 $ 1,233,872 $ 827,344 23
24 122,558 177,888 273,914 110, 920 56,128 24
25 117,562 113,483 109,214 48,500 53,288 25
26 1, 854,795 1,483,397 1,332,831 1,017, 424 690,859 26
27 46,824 38, 329 34,857 68,513 37, 863 27
28 2, 771,889 2,059,427 1,559,851 1,120, 339 832,679 28
29 57,301 61, 857 79,466 58,009 57, 929 29
30 4,999,566 3,967,337 3,467,241 2,452,628 1,741,222 30
31 1, 443,249 1,051,466 1,014,775 735,861 529,475 31
32 978,224 696,484 721,149 503, 696 349, 693 32
33 213,062 162,598 144,554 86,482 75,670 33
34 875,754 967,725 784,991 597, 248 313, 562 34
35 2,432,020 2,110,637 1,864,118 1,390,530 906,569 35
36 $ 2,567,546 $ 1,856,700 $ 1,603,123 $ 1,062,098 $ 834,653 36
37 2. 93 1.92 2. 04 1.78 2.66 37
38 1. 95 2.14 2. 16 2.31 2.09 38
39 12,530 12,728 11,360 8,773 8,475 39
40 730,596 672,984 667,344 620,698 606, 330 40
41 729,516 714,668 692,880 640,102 604, 710 41
42 $ 3. 51 $ 2.76 $ 2.40 $ 1.71 $ 1.38 42
43 $ 10.88 $ 9.72 $ 10.35 $ 7.75 $ 3.59 43
44 $ 7.16 $ 6.50 $ 6. 94 $ 3.33 $ 2.00 44
45 $ 8.91 $ 8.38 $ 8. 69 $ 7.44 $ 3.02 45
46 25 29 33 32 22 46
47 17 19 22 14 13 47
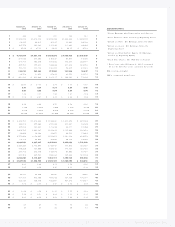
Explanatory Notes
1Pre tax Earnings plus De preciatio n and Inte re st.
2Asse t Turno ve r: Sale s divide d by Be ginning Asse ts.
3Re turn o n Sale s: Ne t Earnings divide d by Sale s.
4Re turn o n Asse ts: Net Earnings divide d by
Be ginning Asse ts.
5Re turn o n Share ho lde rs’ Equity: Ne t Earnings
divide d by Be ginning Equity.
6Sto ck Price Source : The Wall Stree t Journal
* Fiscal ye ar e nde d February 2, 2001 co ntaine d
53 we e ks. All o the r ye ars co ntaine d 5 2 we e ks.
NM = no t me aningful
CGR = co mpo und growth rate