Lowe's 2001 Annual Report Download - page 44
Download and view the complete annual report
Please find page 44 of the 2001 Lowe's annual report below. You can navigate through the pages in the report by either clicking on the pages listed below, or by using the keyword search tool below to find specific information within the annual report.-
 1
1 -
2
-
3
-
4
-
5
-
6
-
7
-
8
-
9
-
10
-
11
-
12
-
13
-
14
-
15
-
16
-
17
-
18
-
19
-
20
-
21
-
22
-
23
-
24
-
25
-
26
-
27
-
28
-
29
-
30
-
31
-
32
-
33
-
 34
34 -
 35
35 -
 36
36 -
 37
37 -
 38
38 -
 39
39 -
 40
40 -
 41
41 -
 42
42 -
 43
43 -
 44
44 -
 45
45 -
 46
46 -
 47
47 -
 48
48
 |
 |

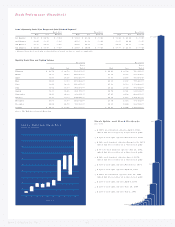
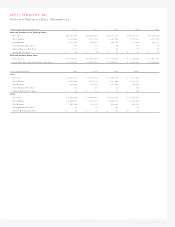
Lo we’s Co mpanies, Inc. 42
5-year February 1 , February 2, January 28, January 29, January 30,
Fiscal Ye ars Ende d On CGR 2002 2001 2000 1999 1998
Stores and People
1Number of Sto res 11.6 744 650 576 520 477
2Square Foo tage 19.1 80,702,076 67, 774,611 56,981,547 47, 795,283 39,860,593
3Number of Emplo ye es 13.1 108,317 94,601 86, 160 72, 715 64, 070
4Custo mer Transactio ns ( In Tho usands) 15.1 395,141 342,173 299,225 268,232 231,000
5Average Purchase $ 55.96 $ 54.88 $ 53.16 $ 49.70 $ 48.09
Comparative I ncome Statements ( I n Thousands)
6 Sales 18.8 $ 22,111,108 $18,778,559 $15,905,595 $13,330,540 $11,108,378
7De pre ciatio n 19.8 516,828 408,618 337,359 288,607 255,694
8Operating Inc o me ( EBITDA) 125.2 2,314,616 1, 810,883 1,485,328 1,156,915 925,940
9Pre-Tax Earnings 27.2 1,624,251 1, 281,440 1,063,117 787,367 598,631
10 Inco me Tax Pro visio n NM 600,989 471,569 390,322 286,992 215,601
11 Net Earnings 26.6 1,023,262 809,871 672,795 500,374 383,030
12 Cash Dividends 11.5 59,884 53,479 47, 558 41,171 38,239
13 Earnings Retained 28.0 $ 963,378 $ 756,392 $ 625,237 $ 459,203 $ 344,791
Dollars Per Share ( Weighted Average Shares, Assuming Dilution)
14 Sale s 16. 8 $ 27.83 $ 24.42 $ 20.72 $ 17.74 $ 14.99
15 Earnings 24.8 1.30 1.05 0.88 0.67 0.52
16 Cash Dividends 9.9 0.08 0.07 0.06 0.06 0.06
17 Earnings Re tained 26.1 1.21 0.98 0.81 0.61 0.47
18 Shareho lders’ Equity 19. 0 $ 8.40 $ 7.15 $ 6.12 $ 4.82 $ 4.02
Financial Ratios
19 Asset Turno ver21.95 2.08 2.24 2.27 2.22
20 Return o n Sales34.63% 4. 31% 4.23% 3.75% 3.45%
21 Return o n Assets49.01% 8.99% 9.49% 8.54% 7.66%
22 Return o n Shareho lders’ Equity518.62% 17. 25% 18.59% 16. 80% 14.92%
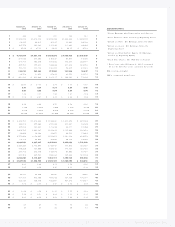
Comparative Balance Sheets ( I n Thousands)
23 To tal Current Assets 18.2 $ 4,920,392 $ 4,157, 426 $ 3,687,590 $ 2,864,574 $ 2,426,636
24 Cash and Sho rt-Term Investments 47.4 853,228 468,529 568,792 249,217 274,858
25 Acco unts Receivable—Net 7. 1 165,578 160,985 147,901 143,928 118,408
26 Merchandise Invento ry 14.3 3,610,776 3,285,370 2,812,361 2,384,700 1,985, 041
27 Other Current Assets 33.5 198,306 161,498 105,391 44,915 38,659
28 Fixe d Assets—Net 25.6 8,653,439 7,034, 960 5, 177,222 4,085,798 3,321,332
29 Other Assets 19.7 140,728 131,091 110,831 107,794 78,661
30 Total Assets 22.4 13,736,219 11,358,167 9,006,757 7,086,882 5,861,790
31 To tal Current Liabilities 15. 9 3,016,830 2,910,998 2,380,388 1,924, 256 1,554,359
32 Acco unts Payable 11.9 1,714, 776 1, 714,370 1,561,380 1,220,543 1,035,882
33 Other Current Liabilities 30.1 795,571 662,410 400,676 269,734 241,041
34 Lo ng- Term Debt ( Excluding Current Maturities) 33.6 3,734,011 2,697,669 1,726,579 1,364,278 1,191, 406
3 5 Total Liabilities 23.8 7,061,777 5,863,282 4,311,286 3,467,115 2,883,786
36 Shareholders’ Equity 21.1 $ 6,674,442 $ 5,494,885 $ 4,695,471 $ 3,619,767 $ 2,978,004
37 Equity/ Long-Term Debt ( Excluding Current Maturities) 1.79 2.04 2.72 2.65 2.50
38 Year-End Leverage Facto r: Assets/ Equity 2. 06 2.07 1.92 1.96 1.97
Shareholders, Shares and Book Value
39 Shareholders o f Reco rd, Year-End 19,277 16,895 15, 446 14,508 12,386
40 Shares Outstanding, Year- End ( In Tho usands) 775,714 766,484 764,718 748,776 738, 476
41 Weig hted Average Shares, Assuming Dilution ( In Thousands) 794,597 768,950 767,708 751,502 741, 264
42 Bo o k Value Per Share $ 8.60 $ 7.17 $ 6.14 $ 4.83 $ 4.03
Stock Price During Calendar Year6( Adjusted for Sto ck Splits)
43 High $ 48.88 $ 33.63 $ 33.22 $ 25.84 $ 12.24
44 Lo w $ 24.79 $ 17.13 $ 21.50 $ 11.00 $ 7.91
45 Clo sing Price December 31 $ 46.41 $ 22. 25 $ 29. 88 $ 25.59 $ 11.93
Price/ Earnings Ratio
46 High 38 32 38 39 24
47 Lo w 19 16 24 16 15
Financial Histo ry ( Unaudited)
10- YEAR FI NANCI AL I NFORMATI ON
*