PG&E 2012 Annual Report Download - page 17
Download and view the complete annual report
Please find page 17 of the 2012 PG&E annual report below. You can navigate through the pages in the report by either clicking on the pages listed below, or by using the keyword search tool below to find specific information within the annual report.-
 1
1 -
2
-
3
-
4
-
5
-
6
-
 7
7 -
 8
8 -
 9
9 -
 10
10 -
 11
11 -
 12
12 -
 13
13 -
 14
14 -
 15
15 -
 16
16 -
 17
17 -
 18
18 -
 19
19 -
 20
20 -
 21
21 -
 22
22 -
 23
23 -
 24
24 -
 25
25 -
 26
26 -
 27
27 -
28
-
29
-
30
-
31
-
32
-
33
-
34
-
35
-
36
-
37
-
38
-
39
-
40
-
41
-
42
-
43
-
44
-
45
-
46
-
47
-
48
-
49
-
50
-
51
-
52
-
53
-
54
-
55
-
56
-
57
-
58
-
59
-
60
-
61
-
62
-
63
-
64
-
65
-
66
-
67
-
68
-
69
-
70
-
71
-
72
-
73
-
74
-
75
-
76
-
77
-
78
-
79
-
80
-
81
-
82
-
83
-
84
-
85
-
86
-
87
-
88
-
89
-
90
-
91
-
92
-
93
-
94
-
95
-
96
-
97
-
98
-
99
-
100
-
101
-
102
-
103
-
104
-
105
-
106
-
107
-
108
-
109
-
110
-
111
-
112
-
113
-
114
-
115
-
116
-
117
-
118
-
119
-
120
-
121
-
122
-
123
-
124
-
125
-
126
-
127
-
128
-
129
-
130
-
131
-
132
-
133
-
134
-
135
-
136
 |
 |

The Utility’s operating revenues for natural gas transmission services are expected to increase for 2013 and 2014
as authorized by the CPUC in the 2011 GT&S rate case and will also be impacted by revenues authorized by the
CPUC in the 2014 GRC. The Utility’s revenues for natural gas distribution services in 2013, excluding revenues
intended to recover passed-through costs, will also reflect revenue increases authorized by the CPUC in the 2011
GRC. These increases to future revenues will be offset by the lower revenues authorized by the CPUC in the 2013
Cost of Capital proceeding. (See ‘‘Regulatory Matters’’ below.) Additionally, the Utility’s future operating revenues
will reflect those revenues authorized by the CPUC under the Utility’s pipeline safety enhancement plan. (See
‘‘Natural Gas Matters’’ below.) The Utility’s future gas operating revenues also will be impacted by the cost of
natural gas, natural gas throughput volume, and other factors.
Cost of Natural Gas
The Utility’s cost of natural gas includes the costs of procurement, storage, transportation of natural gas and
realized gains and losses on price risk management activities. (See Note 10 of the Notes to the Consolidated
Financial Statements.) The Utility’s cost of natural gas is passed through to customers. The Utility’s cost of natural
gas excludes the cost of operating the Utility’s gas transmission and distribution system, which is included in
operating and maintenance expense in the Consolidated Statements of Income.
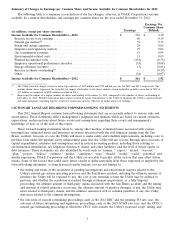
The following table provides a summary of the Utility’s cost of natural gas:
2012 2011 2010
(in millions)
Cost of natural gas sold ...................... $ 676 $ 1,136 $ 1,119
Transportation cost of natural gas sold ........... 185 181 172
Total cost of natural gas ..................... $ 861 $ 1,317 $ 1,291
Average cost per Mcf of natural gas sold ......... $ 2.91 $ 4.49 $ 4.69
Total natural gas sold (in millions of Mcf)(1) ....... 232 253 249
(1) One thousand cubic feet
The Utility’s total cost of natural gas decreased by $456 million, or 35%, in 2012 compared to 2011, primarily
due to a lower average market price of natural gas during 2012.
The Utility’s total cost of natural gas increased by $26 million, or 2%, in 2011 compared to 2010, primarily due
to the absence of a $49 million refund the Utility received in 2010 to be passed through to customers as part of a
litigation settlement.
The Utility’s future cost of natural gas will be affected by the market price of natural gas and changes in
customer demand. In addition, the Utility’s future cost of natural gas may be affected by federal or state legislation
or rules to regulate the GHG emissions from the Utility’s natural gas transportation and distribution facilities and
from natural gas consumed by the Utility’s customers.
Operating and Maintenance
Operating and maintenance expenses consist mainly of the Utility’s costs to operate and maintain its electricity
and natural gas facilities, customer billing and service expenses, the cost of public purpose programs, and
administrative and general expenses. The Utility’s ability to earn its authorized rate of return depends in part on its
ability to manage its expenses and to achieve operational and cost efficiencies.
The Utility’s operating and maintenance expenses (including costs passed through to customers) increased by
$586 million, or 11%, from $5,459 million in 2011 to $6,045 million in 2012. Excluding costs passed through to
customers, operating and maintenance expense increased $488 million, primarily due to costs incurred to improve the
safety and reliability of electric and natural gas operations that were $255 million higher than amounts assumed
under the 2011 rate cases. The remaining increase was attributable to $73 million of net costs associated with natural
gas matters (see table below), $56 million of employee operational performance incentive, and $26 million of
planned maintenance costs associated with the Gateway Generating Station. These costs were partially offset by a
$25 million decrease in legal and regulatory matters, including penalties associated with the Rancho Cordova
accident in 2011. Costs that are passed through to customers and do not impact net income increased by $98 million,
primarily due to costs associated with advanced electric and gas meters that use SmartMeterTM technology and
pension contributions.
13