PG&E 2012 Annual Report Download - page 87
Download and view the complete annual report
Please find page 87 of the 2012 PG&E annual report below. You can navigate through the pages in the report by either clicking on the pages listed below, or by using the keyword search tool below to find specific information within the annual report.-
 1
1 -
2
-
3
-
4
-
5
-
6
-
7
-
8
-
9
-
10
-
11
-
12
-
13
-
14
-
15
-
16
-
17
-
18
-
19
-
20
-
21
-
22
-
23
-
24
-
25
-
26
-
27
-
28
-
29
-
30
-
31
-
32
-
33
-
34
-
35
-
36
-
37
-
38
-
39
-
40
-
41
-
42
-
43
-
44
-
45
-
46
-
47
-
48
-
49
-
50
-
51
-
52
-
53
-
54
-
55
-
56
-
57
-
58
-
59
-
60
-
61
-
62
-
63
-
64
-
65
-
66
-
67
-
68
-
69
-
70
-
71
-
72
-
73
-
74
-
75
-
76
-
 77
77 -
 78
78 -
 79
79 -
 80
80 -
 81
81 -
 82
82 -
 83
83 -
 84
84 -
 85
85 -
 86
86 -
 87
87 -
 88
88 -
 89
89 -
 90
90 -
 91
91 -
 92
92 -
 93
93 -
 94
94 -
 95
95 -
 96
96 -
 97
97 -
98
-
99
-
100
-
101
-
102
-
103
-
104
-
105
-
106
-
107
-
108
-
109
-
110
-
111
-
112
-
113
-
114
-
115
-
116
-
117
-
118
-
119
-
120
-
121
-
122
-
123
-
124
-
125
-
126
-
127
-
128
-
129
-
130
-
131
-
132
-
133
-
134
-
135
-
136
 |
 |

NOTES TO THE CONSOLIDATED FINANCIAL STATEMENTS (Continued)
NOTE 9: INCOME TAXES (Continued)
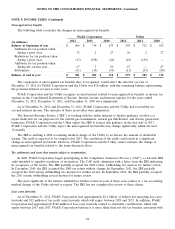
The following table describes net deferred income tax liabilities:
PG&E
Corporation Utility
Year Ended December 31,
2012 2011 2012 2011
(in millions)
Deferred income tax assets:
Customer advances for construction ............... $ 101 $ 108 $ 101 $ 108
Reserve for damages .......................... 175 243 175 243
Environmental reserve ......................... 97 157 97 157
Compensation ............................... 229 310 179 258
Net operating loss carry forward .................. 938 728 736 567
Other ..................................... 264 217 255 180
Total deferred income tax assets ................ $ 1,804 $ 1,763 $ 1,543 $ 1,513
Deferred income tax liabilities:
Regulatory balancing accounts ................... $ 256 $ 643 $ 256 $ 643
Property related basis differences ................. 7,449 6,544 7,447 6,536
Income tax regulatory asset ..................... 663 588 663 588
Other ..................................... 173 192 99 105
Total deferred income tax liabilities ............. $ 8,541 $ 7,967 $ 8,465 $ 7,872
Total net deferred income tax liabilities ........... $ 6,737 $ 6,204 $ 6,922 $ 6,359
Classification of net deferred income tax liabilities:
Included in current liabilities (assets) .............. $ (11) $ 196 $ (17) $ 199
Included in noncurrent liabilities ................. 6,748 6,008 6,939 6,160
Total net deferred income tax liabilities ........... $ 6,737 $ 6,204 $ 6,922 $ 6,359
The following table reconciles income tax expense at the federal statutory rate to the income tax provision:
PG&E Corporation Utility
Year Ended December 31,
2012 2011 2010 2012 2011 2010
Federal statutory income tax rate ..... 35.0% 35.0% 35.0% 35.0% 35.0% 35.0%
Increase (decrease) in income tax rate
resulting from:
State income tax (net of federal
benefit) .................... (3.9) 1.1 0.7 (3.0) 1.6 1.0
Effect of regulatory treatment of
fixed asset differences .......... (4.1) (4.4) (3.1) (3.9) (4.2) (3.0)
Tax credits ................... (0.6) (0.5) (0.4) (0.6) (0.5) (0.4)
Benefit of loss carryback ......... (0.7) (1.9) —(0.4) (2.1) —
Non deductible penalties ......... 0.6 6.5 0.2 0.5 6.3 0.2
Other, net .................... (3.8) (1.5) 0.8 (0.8) 0.1 1.1
Effective tax rate ................ 22.5% 34.3% 33.2% 26.8% 36.2% 33.9%
83