PG&E 2012 Annual Report Download - page 25
Download and view the complete annual report
Please find page 25 of the 2012 PG&E annual report below. You can navigate through the pages in the report by either clicking on the pages listed below, or by using the keyword search tool below to find specific information within the annual report.-
 1
1 -
2
-
3
-
4
-
5
-
6
-
7
-
8
-
9
-
10
-
11
-
12
-
13
-
14
-
 15
15 -
 16
16 -
 17
17 -
 18
18 -
 19
19 -
 20
20 -
 21
21 -
 22
22 -
 23
23 -
 24
24 -
 25
25 -
 26
26 -
 27
27 -
 28
28 -
 29
29 -
 30
30 -
 31
31 -
 32
32 -
 33
33 -
 34
34 -
 35
35 -
36
-
37
-
38
-
39
-
40
-
41
-
42
-
43
-
44
-
45
-
46
-
47
-
48
-
49
-
50
-
51
-
52
-
53
-
54
-
55
-
56
-
57
-
58
-
59
-
60
-
61
-
62
-
63
-
64
-
65
-
66
-
67
-
68
-
69
-
70
-
71
-
72
-
73
-
74
-
75
-
76
-
77
-
78
-
79
-
80
-
81
-
82
-
83
-
84
-
85
-
86
-
87
-
88
-
89
-
90
-
91
-
92
-
93
-
94
-
95
-
96
-
97
-
98
-
99
-
100
-
101
-
102
-
103
-
104
-
105
-
106
-
107
-
108
-
109
-
110
-
111
-
112
-
113
-
114
-
115
-
116
-
117
-
118
-
119
-
120
-
121
-
122
-
123
-
124
-
125
-
126
-
127
-
128
-
129
-
130
-
131
-
132
-
133
-
134
-
135
-
136
 |
 |

nuclear decommissioning trust investments which are largely offset by the amount of cash used to purchase new
nuclear decommissioning trust investments. The funds in the decommissioning trusts, along with accumulated
earnings, are used exclusively for decommissioning and dismantling the Utility’s nuclear generation facilities.
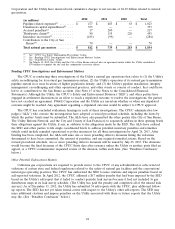
The Utility’s cash flows from investing activities for 2012, 2011, and 2010 were as follows:
2012 2011 2010
(in millions)
Capital expenditures ..................................... $ (4,624) $ (4,038) $ (3,802)
Decrease in restricted cash ................................. 50 200 66
Proceeds from sales and maturities of nuclear decommissioning trust
investments .......................................... 1,133 1,928 1,405
Purchases of nuclear decommissioning trust investments ............ (1,189) (1,963) (1,456)
Other ................................................ 16 14 19
Net cash used in investing activities .......................... $ (4,614) $ (3,859) $ (3,768)
Net cash used in investing activities increased by $755 million in 2012 compared to 2011. This increase was
primarily due to an increase of $586 million in capital expenditures and a reduction in restricted cash released for
resolved Chapter 11 disputed claims of $150 million.
Net cash used in investing activities increased by $91 million in 2011 compared to 2010, primarily due to an
increase in capital expenditures of $236 million as compared to 2010. This increase was partially offset by a decrease
of $134 million in restricted cash that was primarily due to releases from escrow for resolved Chapter 11 disputed
claims in 2011, with few similar releases in 2010.
Future cash flows used in investing activities are largely dependent on the timing and amount of capital
expenditures. (See ‘‘Capital Expenditures’’ below for further discussion of expected spending and significant capital
projects.)
Financing Activities
The Utility’s cash flows from financing activities for 2012, 2011, and 2010 were as follows:
2012 2011 2010
(in millions)
Borrowings under revolving credit facilities ..................... $ — $ 208 $ 400
Repayments under revolving credit facilities .................... —(208) (400)
Net issuances (repayments) of commercial paper, net of discount of $3
in 2012, $4 in 2011, and $3 in 2010 ......................... (1,021) 782 267
Proceeds from issuance of short-term debt, net of issuance costs of $1
in 2011 and 2010 ...................................... — 250 249
Proceeds from issuance of long-term debt, net of premium, discount,
and issuance costs of $13 in 2012, $8 in 2011, and $23 in 2010 ..... 1,137 792 1,327
Short-term debt matured .................................. (250) (250) (500)
Long-term debt matured or repurchased ....................... (50) (700) (95)
Energy recovery bonds matured ............................. (423) (404) (386)
Preferred stock dividends paid .............................. (14) (14) (14)
Common stock dividends paid .............................. (716) (716) (716)
Equity contribution ...................................... 885 555 190
Other ................................................ 28 54 (73)
Net cash provided by (used in) financing activities ............... $ (424) $ 349 $ 249
In 2012, net cash provided by financing activities decreased by $773 million compared to the same period in
2011. In 2011, net cash provided by financing activities increased by $100 million compared to 2010. Cash provided
by or used in financing activities is driven by the Utility’s financing needs, which depend on the level of cash
provided by or used in operating activities and the level of cash provided by or used in investing activities. The
Utility generally utilizes long-term senior unsecured debt issuances and equity contributions from PG&E Corporation
to maintain its CPUC-authorized capital structure, and relies on short-term debt to fund temporary financing needs.
21