PG&E 2012 Annual Report Download - page 5
Download and view the complete annual report
Please find page 5 of the 2012 PG&E annual report below. You can navigate through the pages in the report by either clicking on the pages listed below, or by using the keyword search tool below to find specific information within the annual report.-
 1
1 -
 2
2 -
 3
3 -
 4
4 -
 5
5 -
 6
6 -
 7
7 -
 8
8 -
 9
9 -
 10
10 -
 11
11 -
 12
12 -
 13
13 -
 14
14 -
 15
15 -
 16
16 -
17
-
18
-
19
-
20
-
21
-
22
-
23
-
24
-
25
-
26
-
27
-
28
-
29
-
30
-
31
-
32
-
33
-
34
-
35
-
36
-
37
-
38
-
39
-
40
-
41
-
42
-
43
-
44
-
45
-
46
-
47
-
48
-
49
-
50
-
51
-
52
-
53
-
54
-
55
-
56
-
57
-
58
-
59
-
60
-
61
-
62
-
63
-
64
-
65
-
66
-
67
-
68
-
69
-
70
-
71
-
72
-
73
-
74
-
75
-
76
-
77
-
78
-
79
-
80
-
81
-
82
-
83
-
84
-
85
-
86
-
87
-
88
-
89
-
90
-
91
-
92
-
93
-
94
-
95
-
96
-
97
-
98
-
99
-
100
-
101
-
102
-
103
-
104
-
105
-
106
-
107
-
108
-
109
-
110
-
111
-
112
-
113
-
114
-
115
-
116
-
117
-
118
-
119
-
120
-
121
-
122
-
123
-
124
-
125
-
126
-
127
-
128
-
129
-
130
-
131
-
132
-
133
-
134
-
135
-
136
 |
 |

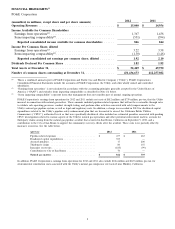
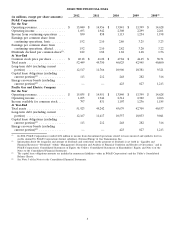
FINANCIAL HIGHLIGHTS(1)
PG&E Corporation
2012 2011
(unaudited, in millions, except share and per share amounts)
Operating Revenues ........................................... $ 15,040 $ 14,956
Income Available for Common Shareholders
Earnings from operations(2) .................................... 1,367 1,438
Items impacting comparability(3) ................................. (551) (594)
Reported consolidated income available for common shareholders ...... 816 844
Income Per Common Share, diluted
Earnings from operations(2) .................................... 3.22 3.58
Items impacting comparability(3) ................................. (1.30) (1.48)
Reported consolidated net earnings per common share, diluted ........ 1.92 2.10
Dividends Declared Per Common Share ............................ 1.82 1.82
Total Assets at December 31, .................................... $ 52,449 $ 49,750
Number of common shares outstanding at December 31, ................ 431,436,673 412,257,082
(1) This is a combined annual report of PG&E Corporation and Pacific Gas and Electric Company (‘‘Utility’’). PG&E Corporation’s
Consolidated Financial Statements include the accounts of PG&E Corporation, the Utility, and other wholly owned and controlled
subsidiaries.
(2) ‘‘Earnings from operations’’ is not calculated in accordance with the accounting principles generally accepted in the United States of
America (‘‘GAAP’’) and excludes items impacting comparability as described in Note (3) below.
(3) ‘‘Items impacting comparability’’ represent items that management does not consider part of normal, ongoing operations.
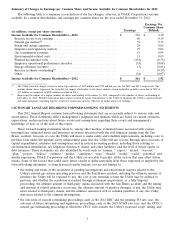
PG&E Corporation’s earnings from operations for 2012 and 2011 exclude net costs of $812 million and $739 million, pre-tax, that the Utility
incurred in connection with natural gas matters. These amounts included pipeline-related expenses that will not be recoverable through rates
to validate safe operating pressures, conduct strength testing, and perform other activities associated with safety improvements to the
Utility’s natural gas pipeline system, as well as legal and regulatory costs. In addition, a charge was recorded in 2012 for disallowed capital
expenditures related to the Utility’s pipeline safety enhancement plan that are forecasted to exceed the California Public Utilities
Commission’s (‘‘CPUC’’) authorized levels or that were specifically disallowed. Also included are estimated penalties associated with pending
CPUC investigations related to various aspects of the Utility’s natural gas operations and other potential enforcement matters, accruals for
third-party claims arising from the natural gas pipeline accident that occurred in San Bruno, California on September 9, 2010, and a
contribution to the City of San Bruno to support the community’s recovery efforts after the accident. These costs were partially offset by
insurance recoveries. See the table below.
(pre-tax) 2012 2011
Pipeline-related expenses ........................ $ 477 $ 483
Disallowed capital expenditures .................... 353 —
Accrued penalties ............................. 17 200
Third-party claims ............................ 80 155
Insurance recoveries ........................... (185) (99)
Contribution to City of San Bruno .................. 70 —
Natural gas matters ........................... $ 812 $ 739
In addition, PG&E Corporation’s earnings from operations for 2012 and 2011 also exclude $106 million and $125 million, pre-tax, for
environmental remediation costs associated with the Utility’s natural gas compressor site located near Hinkley, California.
1