PG&E 2012 Annual Report Download - page 97
Download and view the complete annual report
Please find page 97 of the 2012 PG&E annual report below. You can navigate through the pages in the report by either clicking on the pages listed below, or by using the keyword search tool below to find specific information within the annual report.-
 1
1 -
2
-
3
-
4
-
5
-
6
-
7
-
8
-
9
-
10
-
11
-
12
-
13
-
14
-
15
-
16
-
17
-
18
-
19
-
20
-
21
-
22
-
23
-
24
-
25
-
26
-
27
-
28
-
29
-
30
-
31
-
32
-
33
-
34
-
35
-
36
-
37
-
38
-
39
-
40
-
41
-
42
-
43
-
44
-
45
-
46
-
47
-
48
-
49
-
50
-
51
-
52
-
53
-
54
-
55
-
56
-
57
-
58
-
59
-
60
-
61
-
62
-
63
-
64
-
65
-
66
-
67
-
68
-
69
-
70
-
71
-
72
-
73
-
74
-
75
-
76
-
77
-
78
-
79
-
80
-
81
-
82
-
83
-
84
-
85
-
86
-
 87
87 -
 88
88 -
 89
89 -
 90
90 -
 91
91 -
 92
92 -
 93
93 -
 94
94 -
 95
95 -
 96
96 -
 97
97 -
 98
98 -
 99
99 -
 100
100 -
 101
101 -
 102
102 -
 103
103 -
 104
104 -
 105
105 -
 106
106 -
 107
107 -
108
-
109
-
110
-
111
-
112
-
113
-
114
-
115
-
116
-
117
-
118
-
119
-
120
-
121
-
122
-
123
-
124
-
125
-
126
-
127
-
128
-
129
-
130
-
131
-
132
-
133
-
134
-
135
-
136
 |
 |

NOTES TO THE CONSOLIDATED FINANCIAL STATEMENTS (Continued)
NOTE 11: FAIR VALUE MEASUREMENTS (Continued)
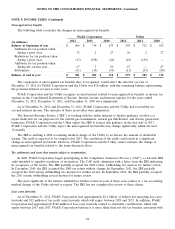
Level 3 Reconciliation
The following table presents the reconciliation for Level 3 price risk management instruments for the years
ended December 31, 2012 and 2011, respectively:
Price Risk
Management
Instruments
2012 2011
(in millions)
Liability balance as of January 1 ........................... $ (74) $ (399)
Realized and unrealized gains (losses):
Included in regulatory assets and liabilities or balancing
accounts(1) ....................................... (5) 122
Transfers out of Level 3 ............................... — 203
Liability balance as of December 31 ........................ $ (79) $ (74)
(1) Price risk management activities are recoverable through customer rates, therefore, balancing account revenue is recorded for
amounts settled and purchased and there is no impact to net income. Unrealized gains and losses are deferred in regulatory
liabilities and assets.
Financial Instruments
PG&E Corporation and the Utility use the following methods and assumptions in estimating fair value for
financial instruments:
• The fair values of cash, restricted cash, net accounts receivable, short-term borrowings, accounts payable,
customer deposits, and the Utility’s variable rate pollution control bond loan agreements approximate their
carrying values at December 31, 2012 and 2011, as they are short-term in nature or have interest rates that
reset daily.
• The fair values of the Utility’s fixed-rate senior notes and fixed-rate pollution control bond loan agreements
and PG&E Corporation’s fixed-rate senior notes were based on quoted market prices at December 31, 2012
and 2011. The fair value of the ERBs issued by PERF was also based on quoted market prices at
December 31, 2011.
The carrying amount and fair value of PG&E Corporation’s and the Utility’s debt instruments were as follows
(the table below excludes financial instruments with carrying values that approximate their fair values):
At December 31,
2012 2011
Carrying Level 2 Carrying Level 2
Amount Fair Value Amount Fair Value
(in millions)
Debt (Note 4)
PG&E Corporation ............. $ 349 $ 371 $ 349 $ 380
Utility ....................... 11,645 13,946 10,545 12,543
Energy recovery bonds (Note 5) ..... ——423 433
93