PG&E 2012 Annual Report Download - page 85
Download and view the complete annual report
Please find page 85 of the 2012 PG&E annual report below. You can navigate through the pages in the report by either clicking on the pages listed below, or by using the keyword search tool below to find specific information within the annual report.-
 1
1 -
2
-
3
-
4
-
5
-
6
-
7
-
8
-
9
-
10
-
11
-
12
-
13
-
14
-
15
-
16
-
17
-
18
-
19
-
20
-
21
-
22
-
23
-
24
-
25
-
26
-
27
-
28
-
29
-
30
-
31
-
32
-
33
-
34
-
35
-
36
-
37
-
38
-
39
-
40
-
41
-
42
-
43
-
44
-
45
-
46
-
47
-
48
-
49
-
50
-
51
-
52
-
53
-
54
-
55
-
56
-
57
-
58
-
59
-
60
-
61
-
62
-
63
-
64
-
65
-
66
-
67
-
68
-
69
-
70
-
71
-
72
-
73
-
74
-
 75
75 -
 76
76 -
 77
77 -
 78
78 -
 79
79 -
 80
80 -
 81
81 -
 82
82 -
 83
83 -
 84
84 -
 85
85 -
 86
86 -
 87
87 -
 88
88 -
 89
89 -
 90
90 -
 91
91 -
 92
92 -
 93
93 -
 94
94 -
 95
95 -
96
-
97
-
98
-
99
-
100
-
101
-
102
-
103
-
104
-
105
-
106
-
107
-
108
-
109
-
110
-
111
-
112
-
113
-
114
-
115
-
116
-
117
-
118
-
119
-
120
-
121
-
122
-
123
-
124
-
125
-
126
-
127
-
128
-
129
-
130
-
131
-
132
-
133
-
134
-
135
-
136
 |
 |

NOTES TO THE CONSOLIDATED FINANCIAL STATEMENTS (Continued)
NOTE 7: PREFERRED STOCK (Continued)
The following table summarizes the Utility’s outstanding preferred stock, none of which had mandatory
redemption provisions at December 31, 2012 and 2011:
(in millions, except share amounts, redemption Shares Outstanding Redemption Price Balance
price, and par value)
Nonredeemable $25 par value preferred stock
5.00% Series ............................ 400,000 N/A $ 10
5.50% Series ............................ 1,173,163 N/A 30
6.00% Series ............................ 4,211,662 N/A 105
Total nonredeemable preferred stock .......... 5,784,825 $ 145
Redeemable $25 par value preferred stock
4.36% Series ............................ 418,291 $ 25.75 $ 11
4.50% Series ............................ 611,142 26.00 15
4.80% Series ............................ 793,031 27.25 20
5.00% Series ............................ 1,778,172 26.75 44
5.00% Series A .......................... 934,322 26.75 23
Total redeemable preferred stock ............. 4,534,958 $ 113
Preferred stock .......................... $ 258
At December 31, 2012, annual dividends on the Utility’s nonredeemable preferred stock ranged from $1.25 to
$1.50 per share. The Utility’s redeemable preferred stock is subject to redemption at the Utility’s option, in whole or
in part, if the Utility pays the specified redemption price plus accumulated and unpaid dividends through the
redemption date. At December 31, 2012, annual dividends on redeemable preferred stock ranged from $1.09 to $1.25
per share.
Dividends on all Utility preferred stock are cumulative. All shares of preferred stock have voting rights and an
equal preference in dividend and liquidation rights. Upon liquidation or dissolution of the Utility, holders of
preferred stock would be entitled to the par value of such shares plus all accumulated and unpaid dividends, as
specified for the class and series. During each of 2012, 2011, and 2010 the Utility paid $14 million of dividends on
preferred stock.
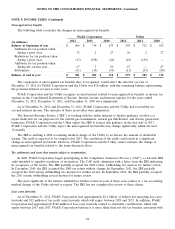
NOTE 8: EARNINGS PER SHARE
PG&E Corporation’s basic earnings per common share (‘‘EPS’’) is calculated by dividing the income available
for common shareholders by the weighted average number of common shares outstanding. PG&E Corporation
applies the treasury stock method of reflecting the dilutive effect of outstanding share-based compensation in the
calculation of diluted EPS. The following is a reconciliation of PG&E Corporation’s income available for common
shareholders and weighted average common shares outstanding for calculating diluted EPS for 2012 and 2011.
Year Ended
December 31,
2012 2011
(in millions, except per share amounts)
Income available for common shareholders ................... $ 816 $ 844
Weighted average common shares outstanding, basic ............ 424 401
Add incremental shares from assumed conversions:
Employee share-based compensation ...................... 1 1
Weighted average common share outstanding, diluted ........... 425 402
Total earnings per common share, diluted ................... $ 1.92 $ 2.10
For 2010, PG&E Corporation calculated EPS using the ‘‘two-class’’ method because PG&E Corporation’s
convertible subordinated notes that were outstanding prior to June 29, 2010 were considered to be participating
81