PG&E 2012 Annual Report Download - page 86
Download and view the complete annual report
Please find page 86 of the 2012 PG&E annual report below. You can navigate through the pages in the report by either clicking on the pages listed below, or by using the keyword search tool below to find specific information within the annual report.-
 1
1 -
2
-
3
-
4
-
5
-
6
-
7
-
8
-
9
-
10
-
11
-
12
-
13
-
14
-
15
-
16
-
17
-
18
-
19
-
20
-
21
-
22
-
23
-
24
-
25
-
26
-
27
-
28
-
29
-
30
-
31
-
32
-
33
-
34
-
35
-
36
-
37
-
38
-
39
-
40
-
41
-
42
-
43
-
44
-
45
-
46
-
47
-
48
-
49
-
50
-
51
-
52
-
53
-
54
-
55
-
56
-
57
-
58
-
59
-
60
-
61
-
62
-
63
-
64
-
65
-
66
-
67
-
68
-
69
-
70
-
71
-
72
-
73
-
74
-
75
-
 76
76 -
 77
77 -
 78
78 -
 79
79 -
 80
80 -
 81
81 -
 82
82 -
 83
83 -
 84
84 -
 85
85 -
 86
86 -
 87
87 -
 88
88 -
 89
89 -
 90
90 -
 91
91 -
 92
92 -
 93
93 -
 94
94 -
 95
95 -
 96
96 -
97
-
98
-
99
-
100
-
101
-
102
-
103
-
104
-
105
-
106
-
107
-
108
-
109
-
110
-
111
-
112
-
113
-
114
-
115
-
116
-
117
-
118
-
119
-
120
-
121
-
122
-
123
-
124
-
125
-
126
-
127
-
128
-
129
-
130
-
131
-
132
-
133
-
134
-
135
-
136
 |
 |

NOTES TO THE CONSOLIDATED FINANCIAL STATEMENTS (Continued)
NOTE 8: EARNINGS PER SHARE (Continued)
securities. In applying the two-class method, undistributed earnings were allocated to both common shares and
participating securities. In calculating diluted EPS for 2010, PG&E Corporation applied the ‘‘if-converted’’ method to
reflect the dilutive effect of the convertible subordinated notes to the extent that the impact was dilutive when
compared to basic EPS. The following is a reconciliation of PG&E Corporation’s income available for common
shareholders and weighted average common shares outstanding for calculating basic and diluted EPS for 2010:
Year Ended
December 31, 2010
Basic Diluted
(in millions, except per share amounts)
Income available for common shareholders ................................ $ 1,099 $ 1,099
Less: distributed earnings to common shareholders .......................... 706 —
Undistributed earnings ............................................... $ 393 $ 1,099
Allocation of earnings to common shareholders
Distributed earnings to common shareholders .............................. $ 706 $ —
Undistributed earnings allocated to common shareholders ..................... 385 1,099
Add: Interest expense on convertible subordinated notes, net of tax .............. — 8
Total common shareholders earnings and assumed conversion .................. $ 1,091 $ 1,107
Weighted average common shares outstanding .............................. 382 382
Add incremental shares from assumed conversions:
Convertible subordinated notes ....................................... 8 8
Employee share-based compensation ................................... — 2
Weighted average common shares outstanding and participating securities ......... 390 392
Net earnings per common share, basic
Distributed earnings, basic(1) ........................................... $ 1.85 $ —
Undistributed earnings ............................................... 1.01 2.82
Total ............................................................ $ 2.86 $ 2.82
(1) Distributed earnings, basic may differ from actual per share amounts paid as dividends, as the EPS computation under GAAP requires the
use of the weighted average, rather than the actual, number of shares outstanding.
For each of the periods presented above, the calculation of outstanding common shares on a diluted basis
excluded an insignificant amount of options and securities that were antidilutive.
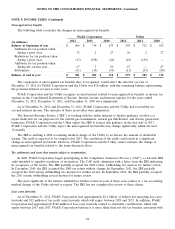
NOTE 9: INCOME TAXES
The significant components of income tax provision (benefit) by taxing jurisdiction were as follows:
PG&E Corporation Utility
Year Ended December 31,
2012 2011 2010 2012 2011 2010
(in millions)
Current:
Federal ............ $ (74) $ (77) $ (12) $ (52) $ (83) $ (54)
State ............. 33 152 130 41 161 134
Deferred:
Federal ............ 374 504 525 404 534 589
State ............. (92) (135) (91) (91) (128) (90)
Tax credits ........... (4) (4) (5) (4) (4) (5)
Income tax provision .. $ 237 $ 440 $ 547 $ 298 $ 480 $ 574
82