PG&E 2012 Annual Report Download - page 24
Download and view the complete annual report
Please find page 24 of the 2012 PG&E annual report below. You can navigate through the pages in the report by either clicking on the pages listed below, or by using the keyword search tool below to find specific information within the annual report.-
 1
1 -
2
-
3
-
4
-
5
-
6
-
7
-
8
-
9
-
10
-
11
-
12
-
13
-
 14
14 -
 15
15 -
 16
16 -
 17
17 -
 18
18 -
 19
19 -
 20
20 -
 21
21 -
 22
22 -
 23
23 -
 24
24 -
 25
25 -
 26
26 -
 27
27 -
 28
28 -
 29
29 -
 30
30 -
 31
31 -
 32
32 -
 33
33 -
 34
34 -
35
-
36
-
37
-
38
-
39
-
40
-
41
-
42
-
43
-
44
-
45
-
46
-
47
-
48
-
49
-
50
-
51
-
52
-
53
-
54
-
55
-
56
-
57
-
58
-
59
-
60
-
61
-
62
-
63
-
64
-
65
-
66
-
67
-
68
-
69
-
70
-
71
-
72
-
73
-
74
-
75
-
76
-
77
-
78
-
79
-
80
-
81
-
82
-
83
-
84
-
85
-
86
-
87
-
88
-
89
-
90
-
91
-
92
-
93
-
94
-
95
-
96
-
97
-
98
-
99
-
100
-
101
-
102
-
103
-
104
-
105
-
106
-
107
-
108
-
109
-
110
-
111
-
112
-
113
-
114
-
115
-
116
-
117
-
118
-
119
-
120
-
121
-
122
-
123
-
124
-
125
-
126
-
127
-
128
-
129
-
130
-
131
-
132
-
133
-
134
-
135
-
136
 |
 |

As the Utility focuses on improving the safety and reliability of its natural gas and electric operations, and
subject to the outcome of the matters described under ‘‘Natural Gas Matters’’ below, PG&E Corporation expects
that its Board will continue to maintain the current quarterly common stock dividend.
Utility
Operating Activities
The Utility’s cash flows from operating activities primarily consist of receipts from customers less payments of
operating expenses, other than expenses such as depreciation that do not require the use of cash.
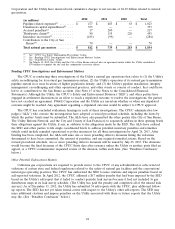
The Utility’s cash flows from operating activities for 2012, 2011, and 2010 were as follows:
2012 2011 2010
(in millions)
Net income ............................................ $ 811 $ 845 $ 1,121
Adjustments to reconcile net income to net cash provided by operating
activities:
Depreciation, amortization, and decommissioning ............... 2,272 2,215 1,905
Allowance for equity funds used during construction ............ (107) (87) (110)
Deferred income taxes and tax credits, net .................... 684 582 762
Disallowed capital expenditures ............................ 353 — 36
Other .............................................. 236 289 221
Effect of changes in operating assets and liabilities:
Accounts receivable ................................... (40) (227) (105)
Inventories ......................................... (24) (63) (43)
Accounts payable .................................... (26) 51 109
Income taxes receivable/payable .......................... (50) (192) (58)
Other current assets and liabilities ........................ 272 36 123
Regulatory assets, liabilities, and balancing accounts, net ........ 291 (100) (394)
Other noncurrent assets and liabilities ..................... 256 414 (331)
Net cash provided by operating activities ...................... $ 4,928 $ 3,763 $ 3,236
During 2012, net cash provided by operating activities increased by $1,165 million compared to 2011. This
increase was primarily due to a decrease of $352 million in net collateral paid by the Utility related to price risk
management activities, a $353 million disallowance for capital expenditures incurred in connection with its pipeline
safety enhancement plan, a receipt of $250 million, net of legal fees, from the U.S. Treasury related to spent nuclear
fuel costs, and a decrease in tax payments of $224 million. The remaining changes in cash flows from operating
activities consisted of fluctuations in activities within the normal course of business such as the timing and amount of
customer billings and collections.
During 2011, net cash provided by operating activities increased $527 million compared to 2010 primarily due to
a decrease of $214 million in net collateral paid by the Utility related to price risk management activities. This
increase also reflects a decrease in tax payments of $121 million in 2011 compared to 2010. The remaining changes
in cash flows from operating activities consisted of fluctuations in activities within the normal course of business such
as collateral and the timing and amount of customer billings and collections.
Future cash flow from operating activities will be affected by the timing and amount of payments to be made to
third parties in connection with the San Bruno accident, including related insurance recoveries; the timing and
amount of penalties that may be assessed, as well as any remedial actions the CPUC may order the Utility to
perform; and the anticipated higher operating and maintenance costs associated with the Utility’s natural gas and
electric operations, among other factors. (See ‘‘Operating and Maintenance’’ above and ‘‘Natural Gas Matters’’
below.)
Investing Activities
The Utility’s investing activities primarily consist of construction of new and replacement facilities necessary to
deliver safe and reliable electricity and natural gas services to its customers. The amount and timing of the Utility’s
capital expenditures is affected by many factors such as the occurrence of storms and other events causing outages or
damages to the Utility’s infrastructure. Cash used in investing activities also includes the proceeds from sales of
20