PG&E 2012 Annual Report Download - page 19
Download and view the complete annual report
Please find page 19 of the 2012 PG&E annual report below. You can navigate through the pages in the report by either clicking on the pages listed below, or by using the keyword search tool below to find specific information within the annual report.-
 1
1 -
2
-
3
-
4
-
5
-
6
-
7
-
8
-
 9
9 -
 10
10 -
 11
11 -
 12
12 -
 13
13 -
 14
14 -
 15
15 -
 16
16 -
 17
17 -
 18
18 -
 19
19 -
 20
20 -
 21
21 -
 22
22 -
 23
23 -
 24
24 -
 25
25 -
 26
26 -
 27
27 -
 28
28 -
 29
29 -
30
-
31
-
32
-
33
-
34
-
35
-
36
-
37
-
38
-
39
-
40
-
41
-
42
-
43
-
44
-
45
-
46
-
47
-
48
-
49
-
50
-
51
-
52
-
53
-
54
-
55
-
56
-
57
-
58
-
59
-
60
-
61
-
62
-
63
-
64
-
65
-
66
-
67
-
68
-
69
-
70
-
71
-
72
-
73
-
74
-
75
-
76
-
77
-
78
-
79
-
80
-
81
-
82
-
83
-
84
-
85
-
86
-
87
-
88
-
89
-
90
-
91
-
92
-
93
-
94
-
95
-
96
-
97
-
98
-
99
-
100
-
101
-
102
-
103
-
104
-
105
-
106
-
107
-
108
-
109
-
110
-
111
-
112
-
113
-
114
-
115
-
116
-
117
-
118
-
119
-
120
-
121
-
122
-
123
-
124
-
125
-
126
-
127
-
128
-
129
-
130
-
131
-
132
-
133
-
134
-
135
-
136
 |
 |
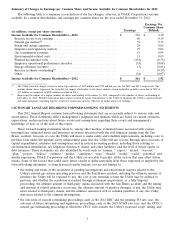
Depreciation, Amortization, and Decommissioning
The Utility’s depreciation and amortization expense consists of depreciation and amortization on plant and
regulatory assets, and decommissioning expenses associated with fossil fuel-fired generation facilities and nuclear
power facilities. The Utility’s depreciation, amortization, and decommissioning expenses increased by $57 million, or
3%, in 2012 compared to 2011, primarily due to capital additions.
The Utility’s depreciation, amortization, and decommissioning expenses increased by $310 million, or 16%, in
2011 compared to 2010, primarily due to capital additions and an increase in depreciation rates as authorized by the
2011 GRC and 2011 GT&S rate cases.
The Utility’s depreciation expense for future periods is expected to be affected as a result of changes in capital
expenditures and the implementation of new depreciation rates as authorized by the CPUC in future GRCs and
GT&S rate cases. Future TO rate cases authorized by the FERC will also have an impact on depreciation rates.
Interest Income and Interest Expense
There were no material changes to interest income and interest expense for 2012 compared to 2011 or for 2011
compared to 2010.
Other Income, Net
The Utility’s other income, net increased by $35 million, in 2012 compared to 2011. The increase was primarily
due to an increase in allowance for equity funds used during construction (‘‘AFUDC’’) as the average balance of
construction work in progress was higher in 2012 as compared to 2011.
The Utility’s other income, net increased by $31 million, in 2011 compared to 2010 when the Utility incurred
costs to support a California ballot initiative that appeared on the June 2010 ballot that were not recoverable in
rates. The increase was partially offset by a decrease in AFUDC as the average balance of construction work in
progress was lower in 2011 compared to 2010.
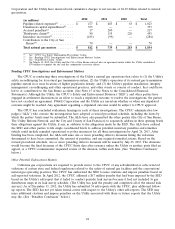
Income Tax Provision
The Utility’s income tax provision decreased by $182 million, or 38%, in 2012 compared to 2011. The effective
tax rates were 27% and 36% for 2012 and 2011, respectively. The effective tax rates for 2012 decreased compared to
2011, primarily due to lower non-tax deductible penalties related to natural gas matters, and higher state benefits
received and deductions in 2012, including a benefit associated with a California research and development claim,
with no comparable amount in 2011; a higher California tax deduction resulting from an accounting method change
for repairs as compared to 2011; and a California tax benefit associated with shorter depreciable lives related to
meters that use SmartMeterTM technology recorded in 2012 with no comparable amount in 2011.
The Utility’s income tax provision decreased by $94 million, or 16%, in 2011 compared to 2010. The effective
tax rates were 36% and 34% for 2011 and 2010, respectively. The effective tax rate for 2011 increased as compared
to 2010, mainly due to non- tax deductible penalties related to natural gas matters recorded in 2011, with no
comparable penalties recorded in 2010, partially offset by a benefit associated with a loss carryback recorded in 2011
and the reversal of a deferred tax asset attributable to the Medicare Part D subsidy, which affected the tax provision
balance in 2010, with no comparable effect in 2011.
15